 2
2peptides
spectra
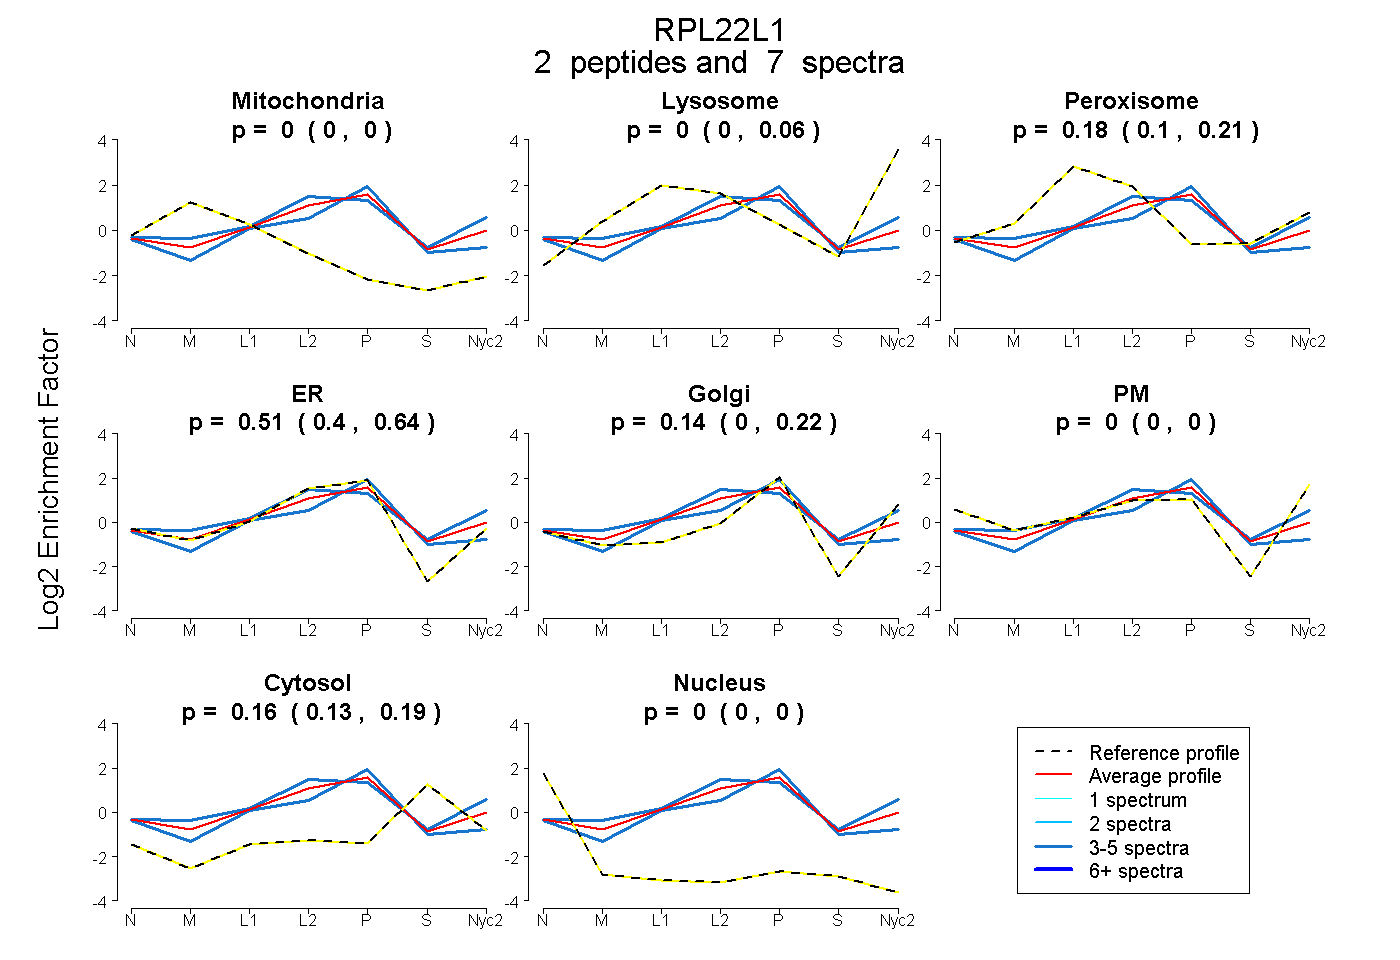
0.000 | 0.000
0.000 | 0.060
0.105 | 0.209
0.399 | 0.644
0.000 | 0.224
0.000 | 0.000
0.133 | 0.194
0.000 | 0.000
1peptide
spectra
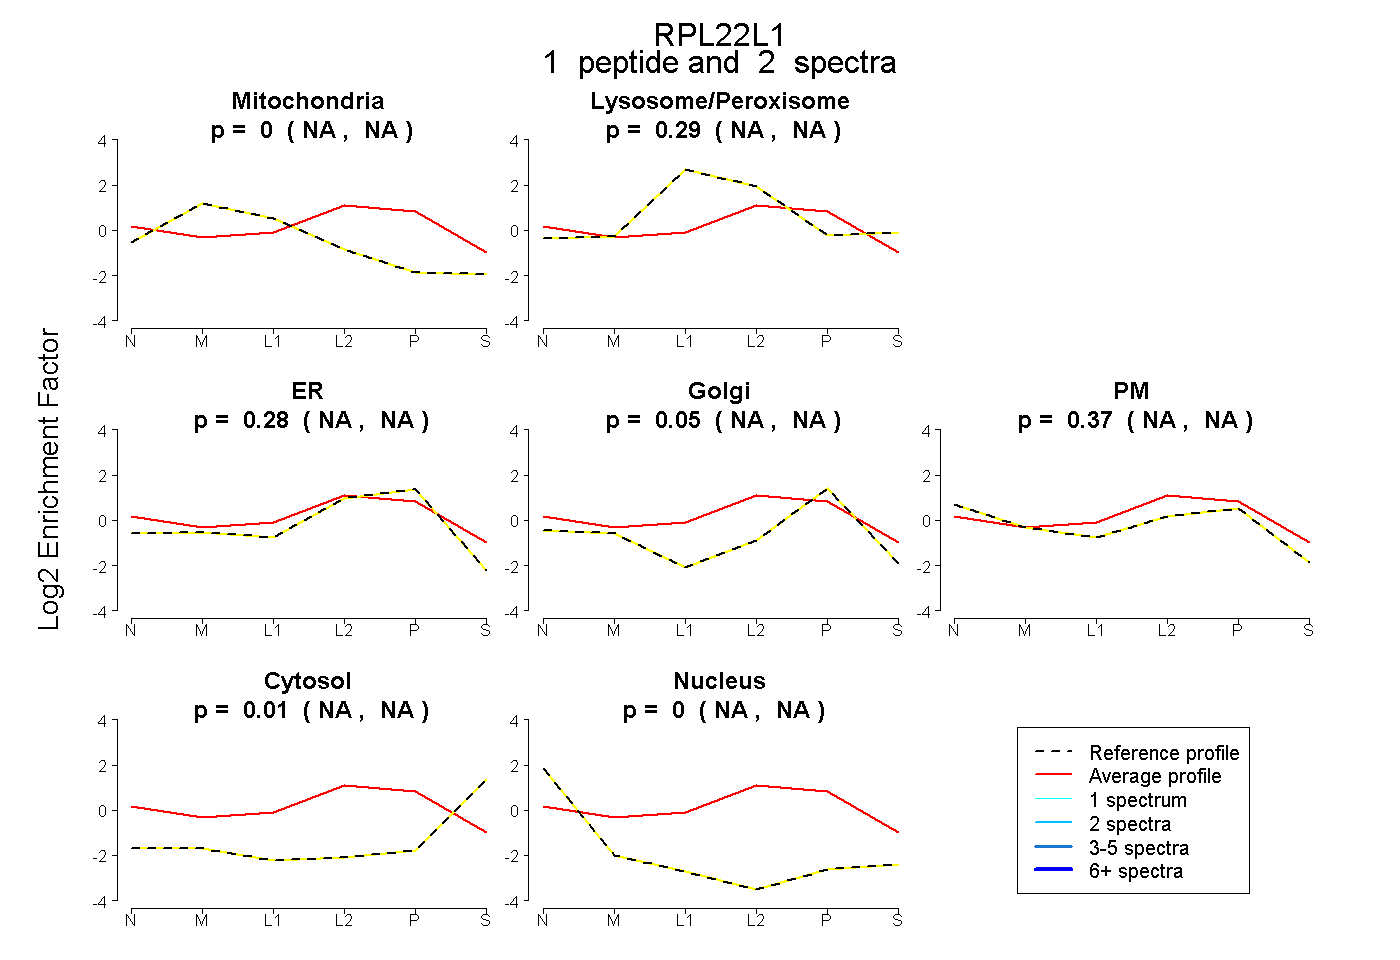
NA | NA
NA | NA
NA | NA
NA | NA
NA | NA
NA | NA
NA | NA
3peptides
spectra
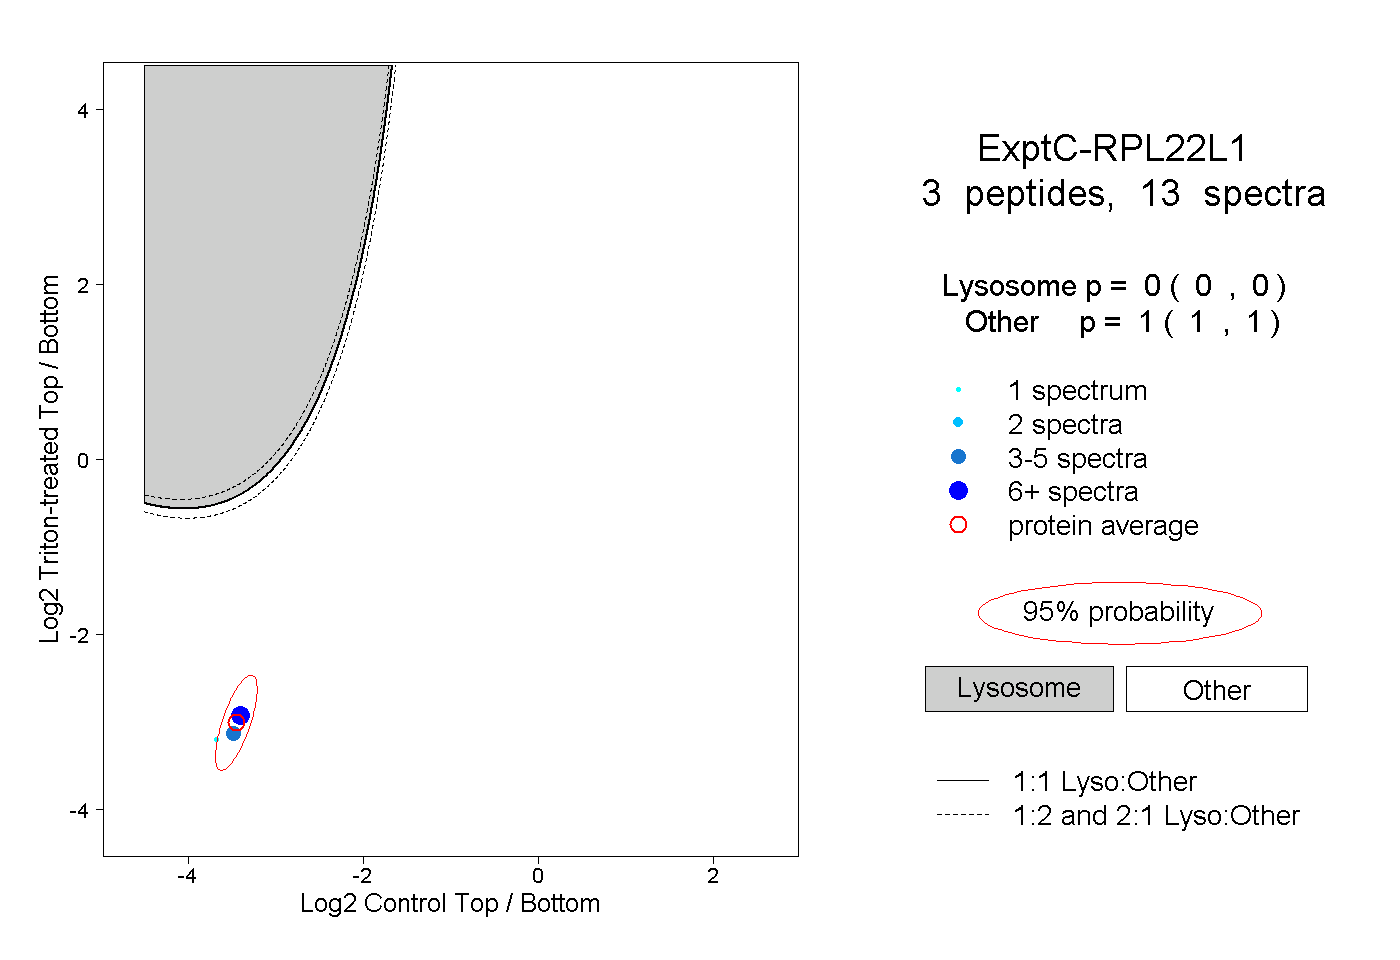
0.000 | 0.000
1.000 | 1.000