 2
2peptides
spectra
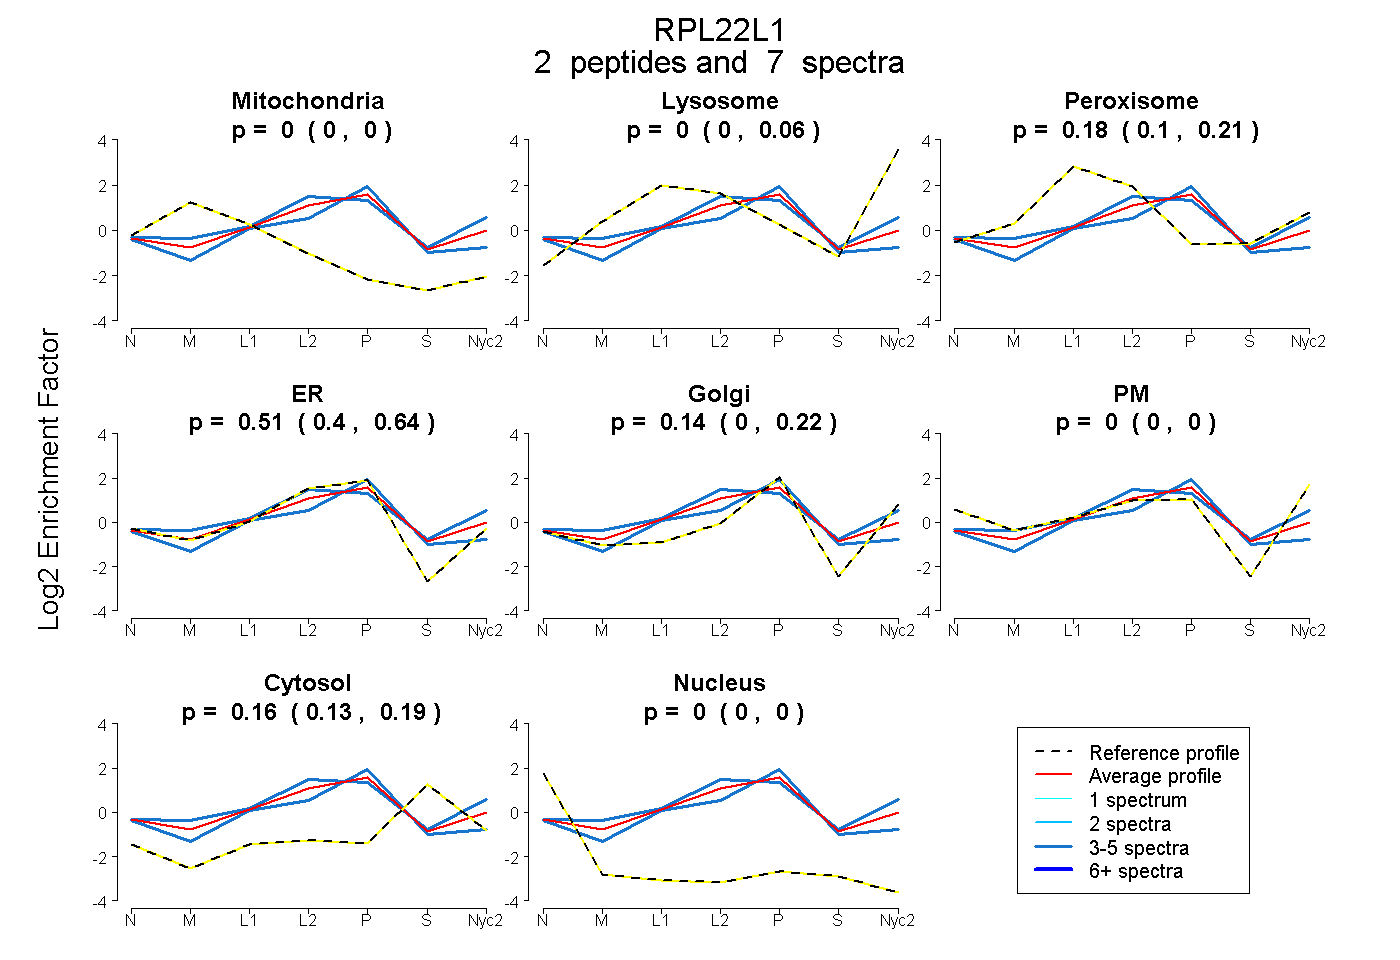
0.000 | 0.000
0.000 | 0.060
0.105 | 0.209
0.399 | 0.644
0.000 | 0.224
0.000 | 0.000
0.133 | 0.194
0.000 | 0.000
| Plot | Mito | Lyso | Perox | ER | Golgi | PM | Cytosol | Nucleus | |||||
| Expt A |
2 peptides |
7 spectra |
|
0.000 0.000 | 0.000 |
0.000 0.000 | 0.060 |
0.183 0.105 | 0.209 |
0.512 0.399 | 0.644 |
0.145 0.000 | 0.224 |
0.000 0.000 | 0.000 |
0.160 0.133 | 0.194 |
0.000 0.000 | 0.000 |
| 3 spectra, ITVVSEK | 0.000 | 0.000 | 0.000 | 0.743 | 0.000 | 0.000 | 0.257 | 0.000 | ||
| 4 spectra, TGNLGNVVHIER | 0.000 | 0.163 | 0.119 | 0.512 | 0.000 | 0.060 | 0.146 | 0.000 |
| Plot | Mito | Lyso or Perox | ER | Golgi | PM | Cytosol | Nucleus | ||||||
| Expt B |
1 peptide |
2 spectra |
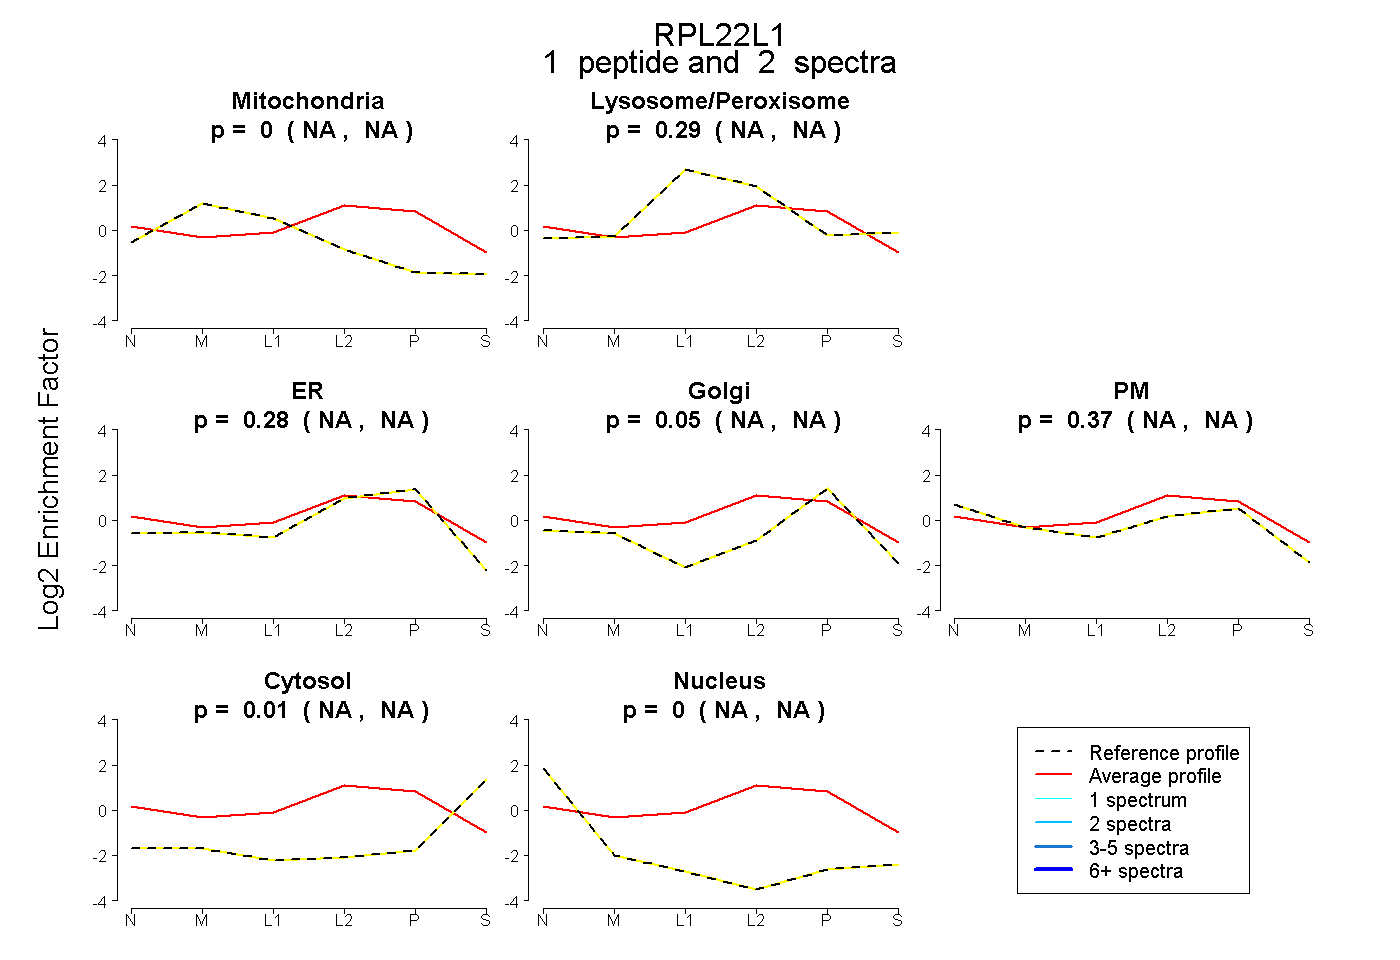 |
0.000 NA | NA |
0.291 NA | NA |
0.277 NA | NA |
0.053 NA | NA |
0.371 NA | NA |
0.009 NA | NA |
0.000 NA | NA |
|||
| Plot | Lyso | Other | |||||||||||
| Expt C |
3 peptides |
13 spectra |
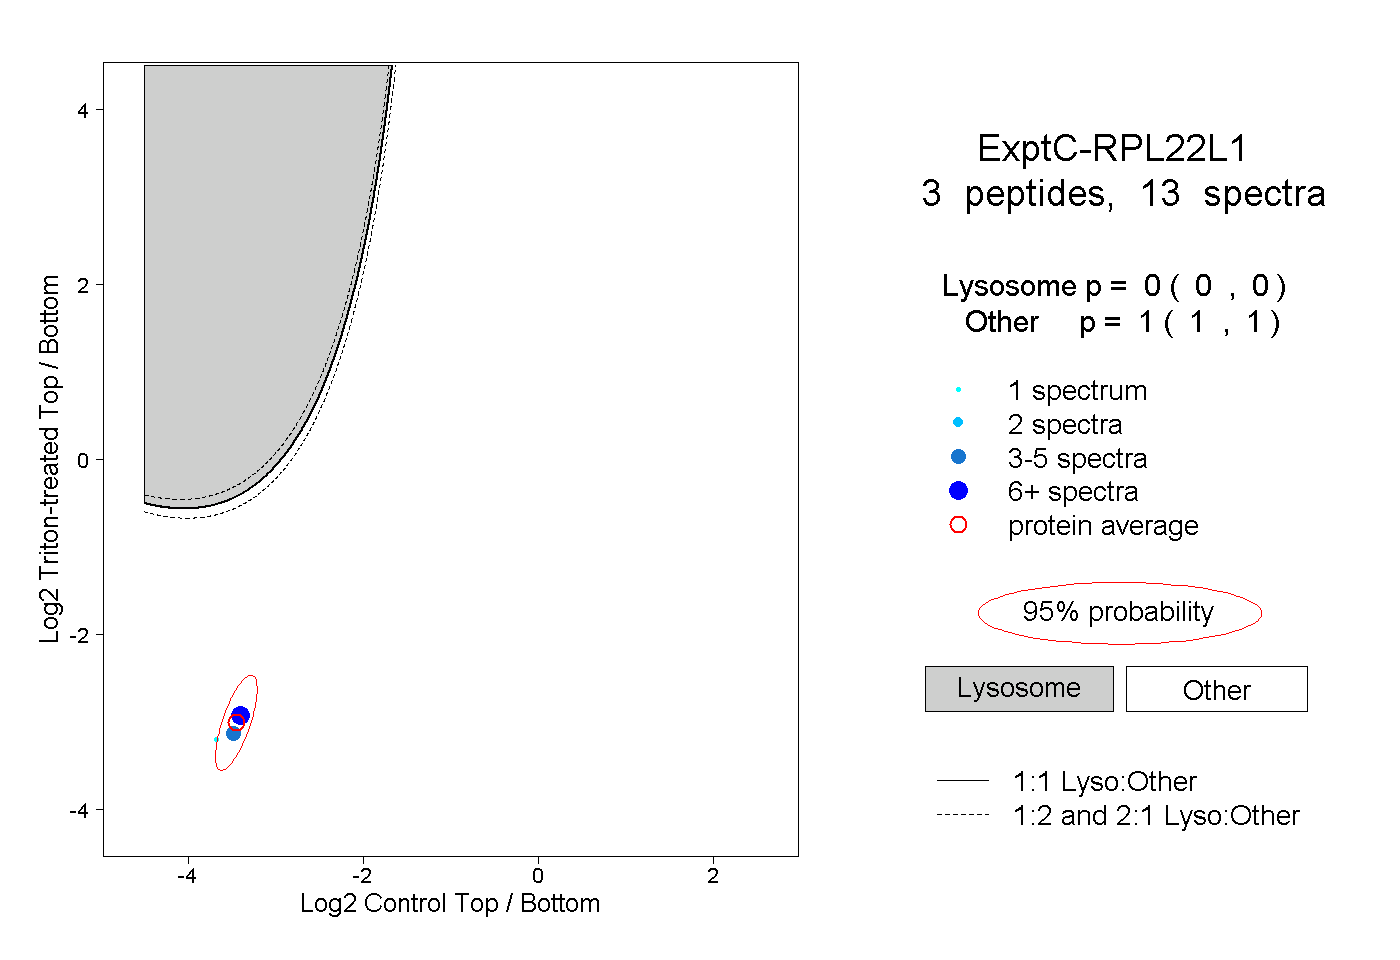 |
0.000 0.000 | 0.000 |
1.000 1.000 | 1.000 |