 11
11peptides
spectra
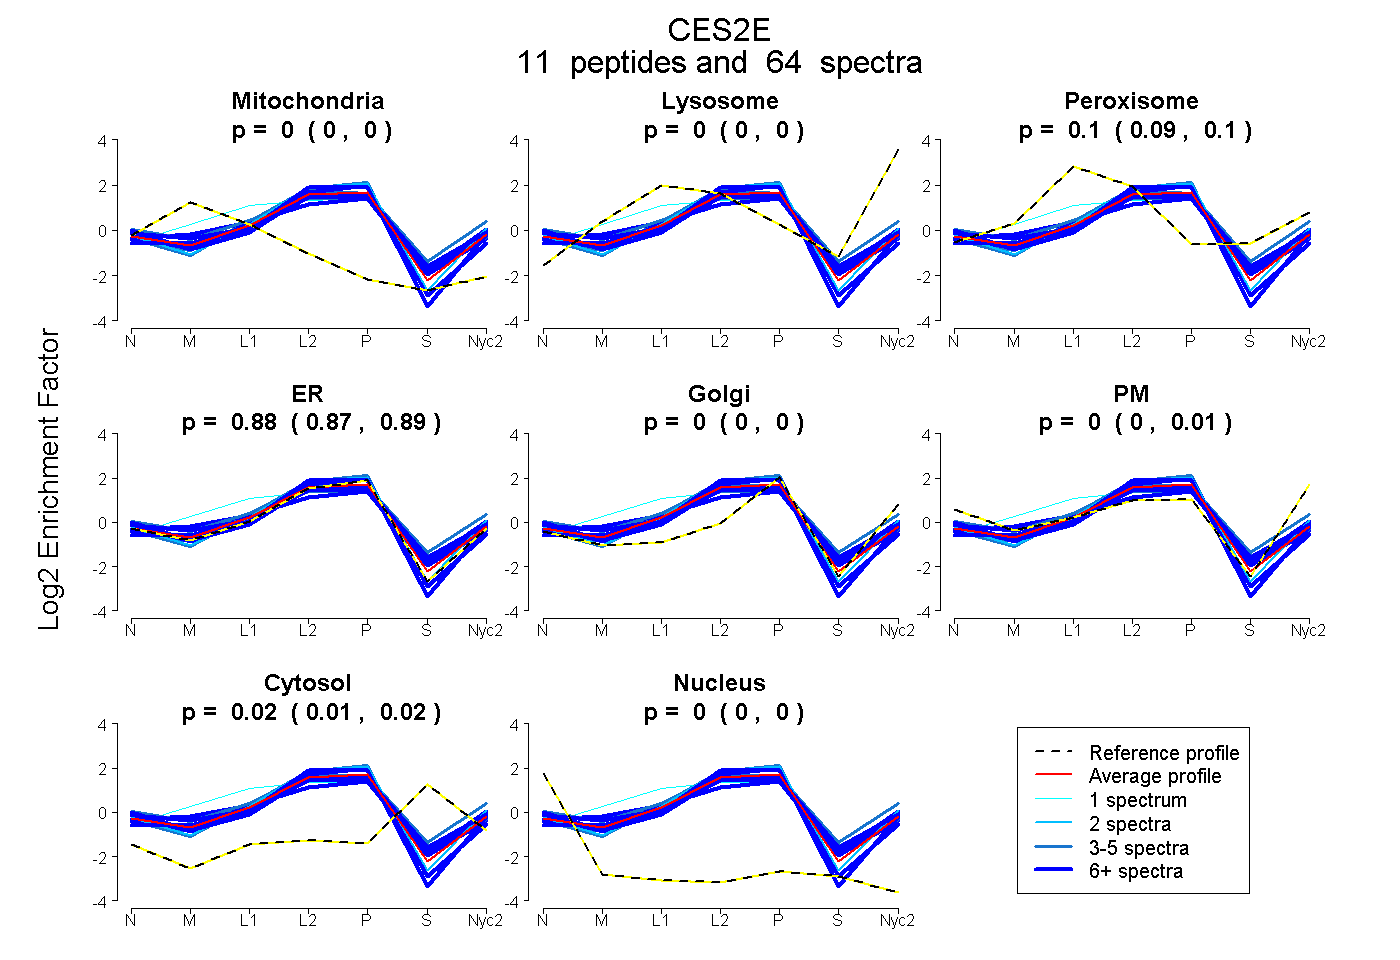
0.000 | 0.000
0.000 | 0.004
0.089 | 0.101
0.872 | 0.888
0.000 | 0.002
0.000 | 0.009
0.015 | 0.025
0.000 | 0.000
7peptides
spectra
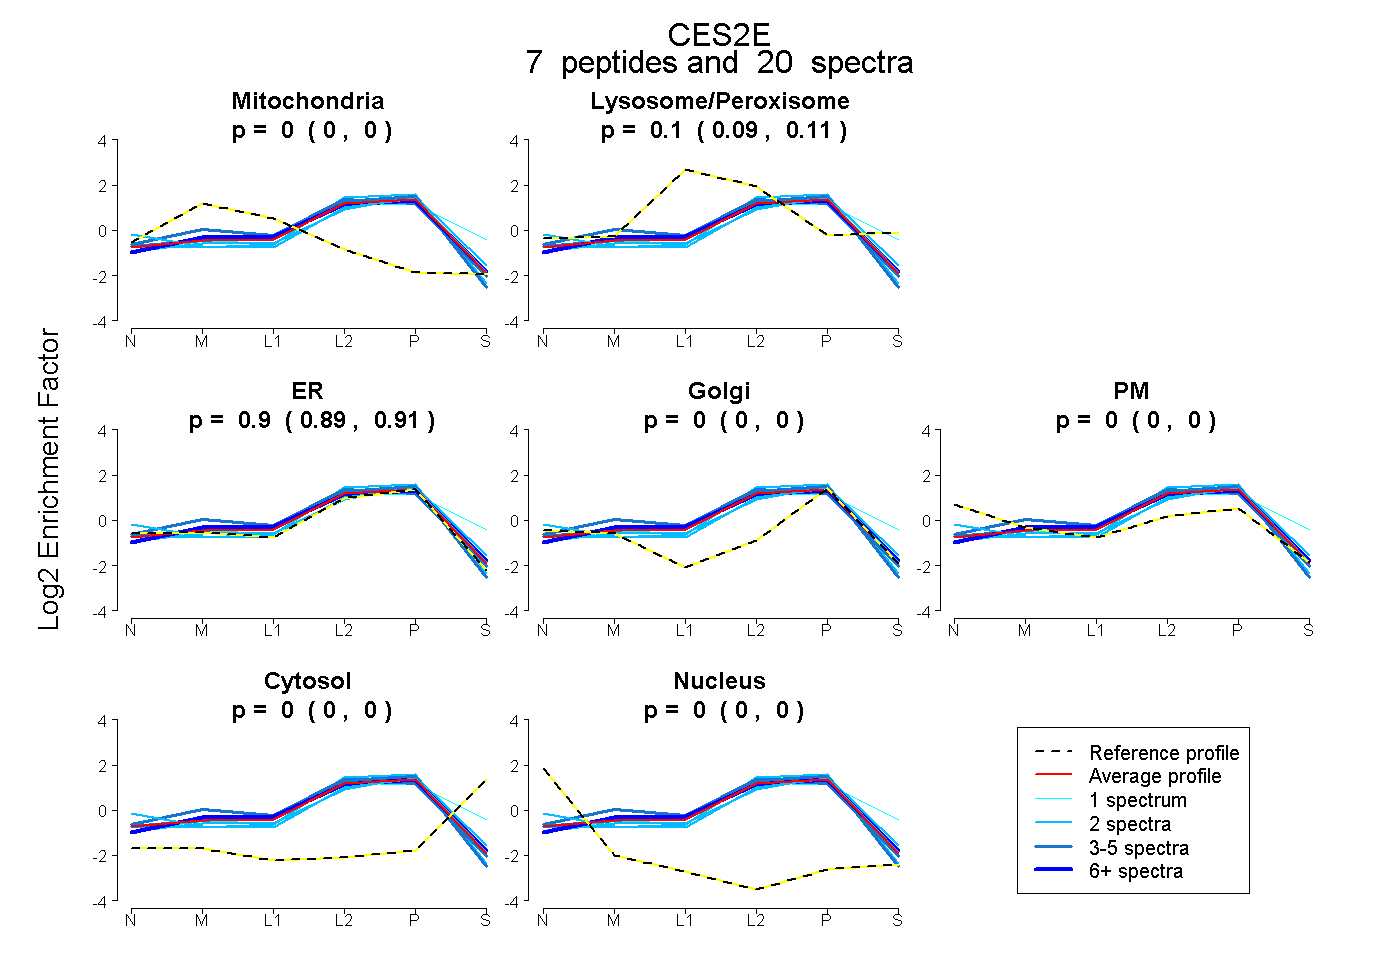
0.000 | 0.000
0.091 | 0.111
0.888 | 0.907
0.000 | 0.000
0.000 | 0.000
0.000 | 0.000
0.000 | 0.000
10peptides
spectra
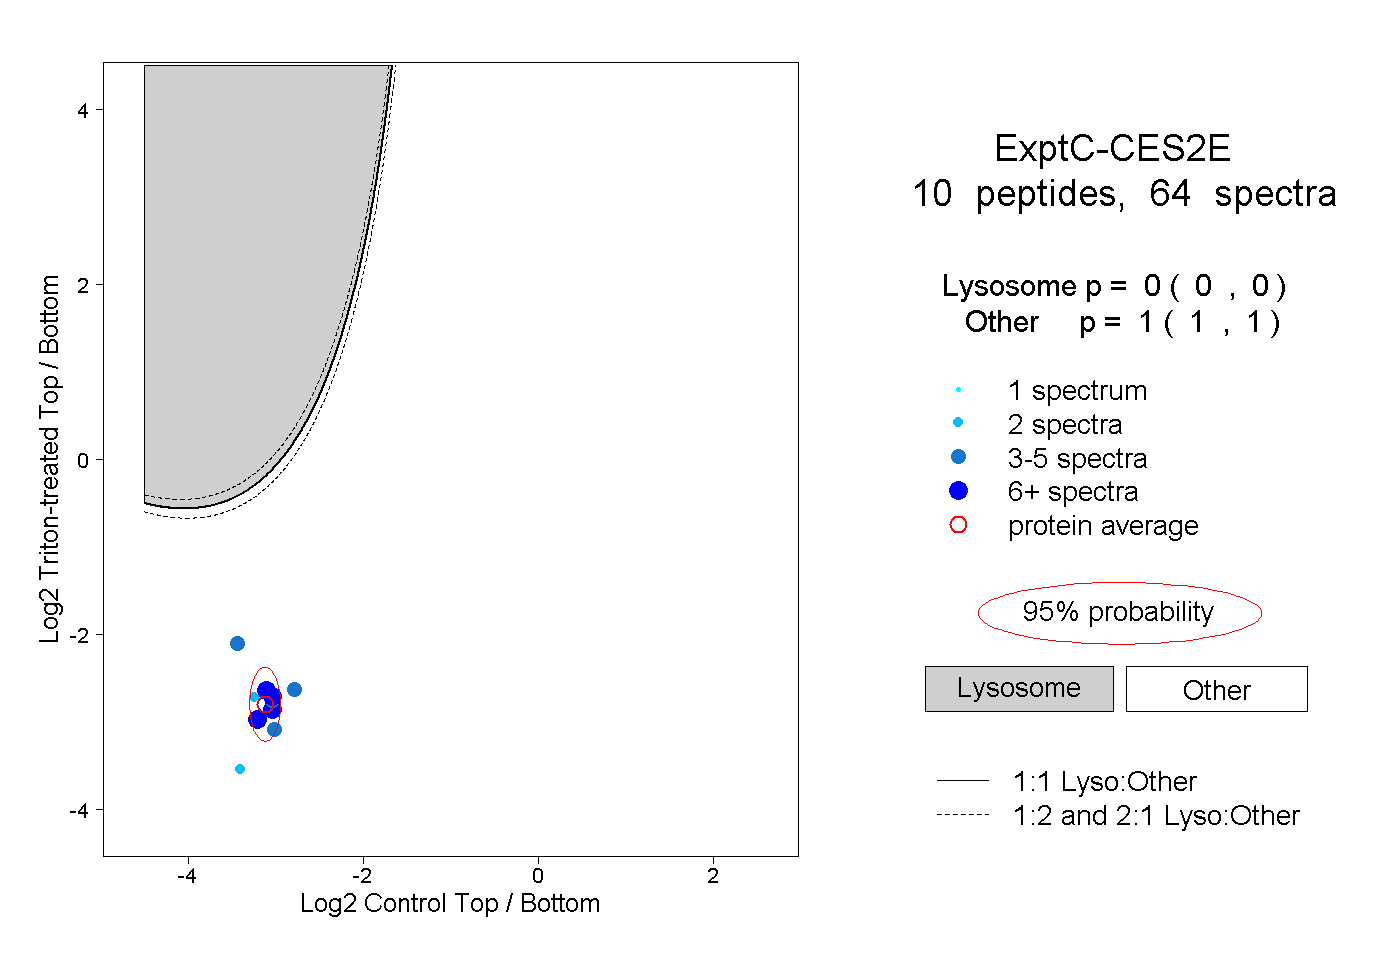
0.000 | 0.000
1.000 | 1.000
2peptides
spectra
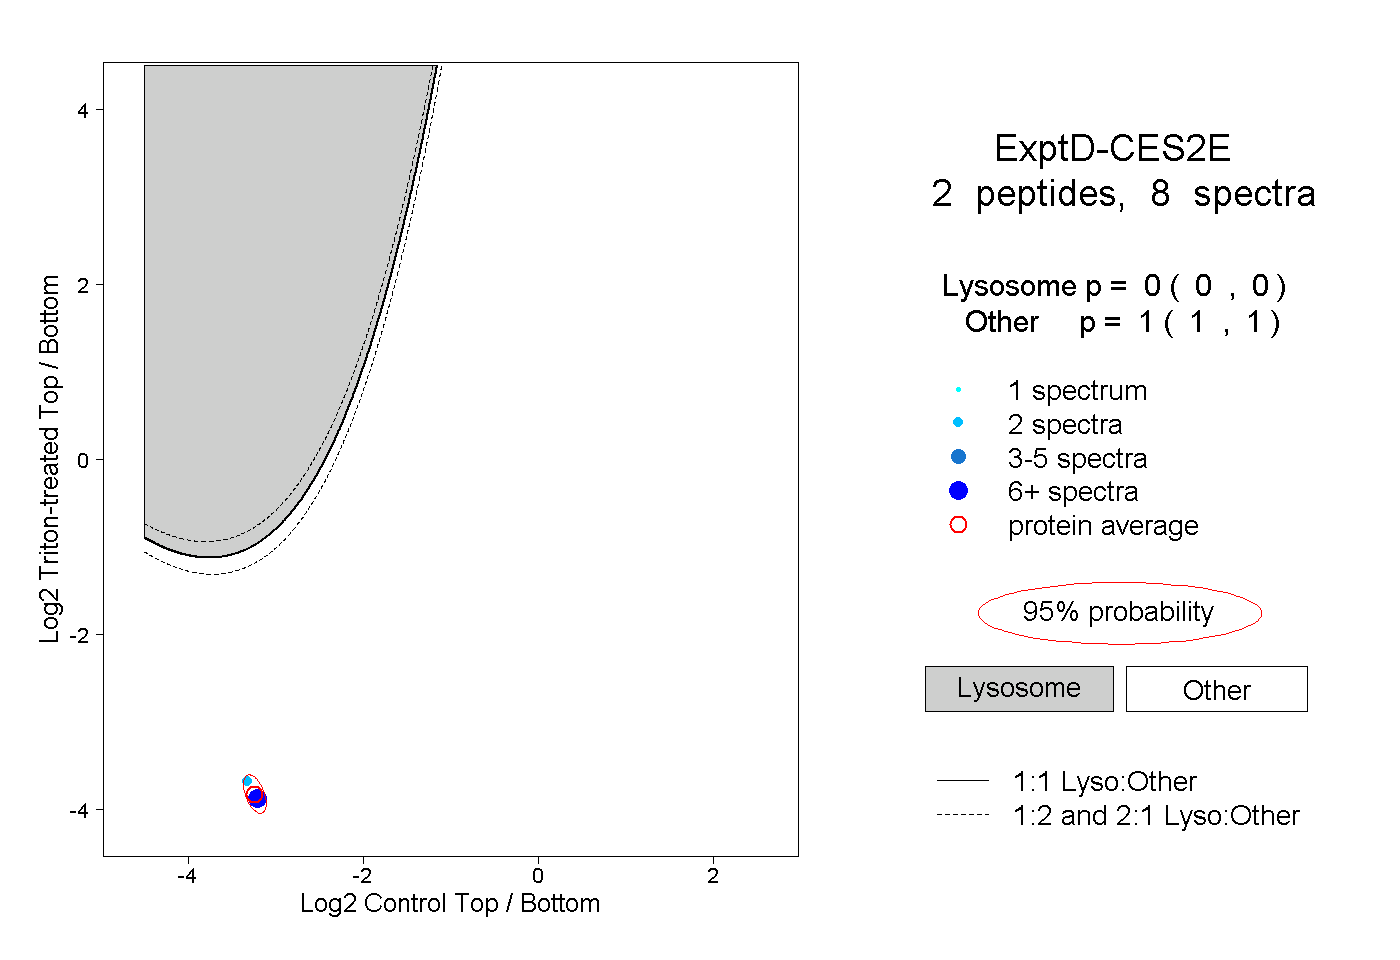
0.000 | 0.000
1.000 | 1.000