 11
11peptides
spectra
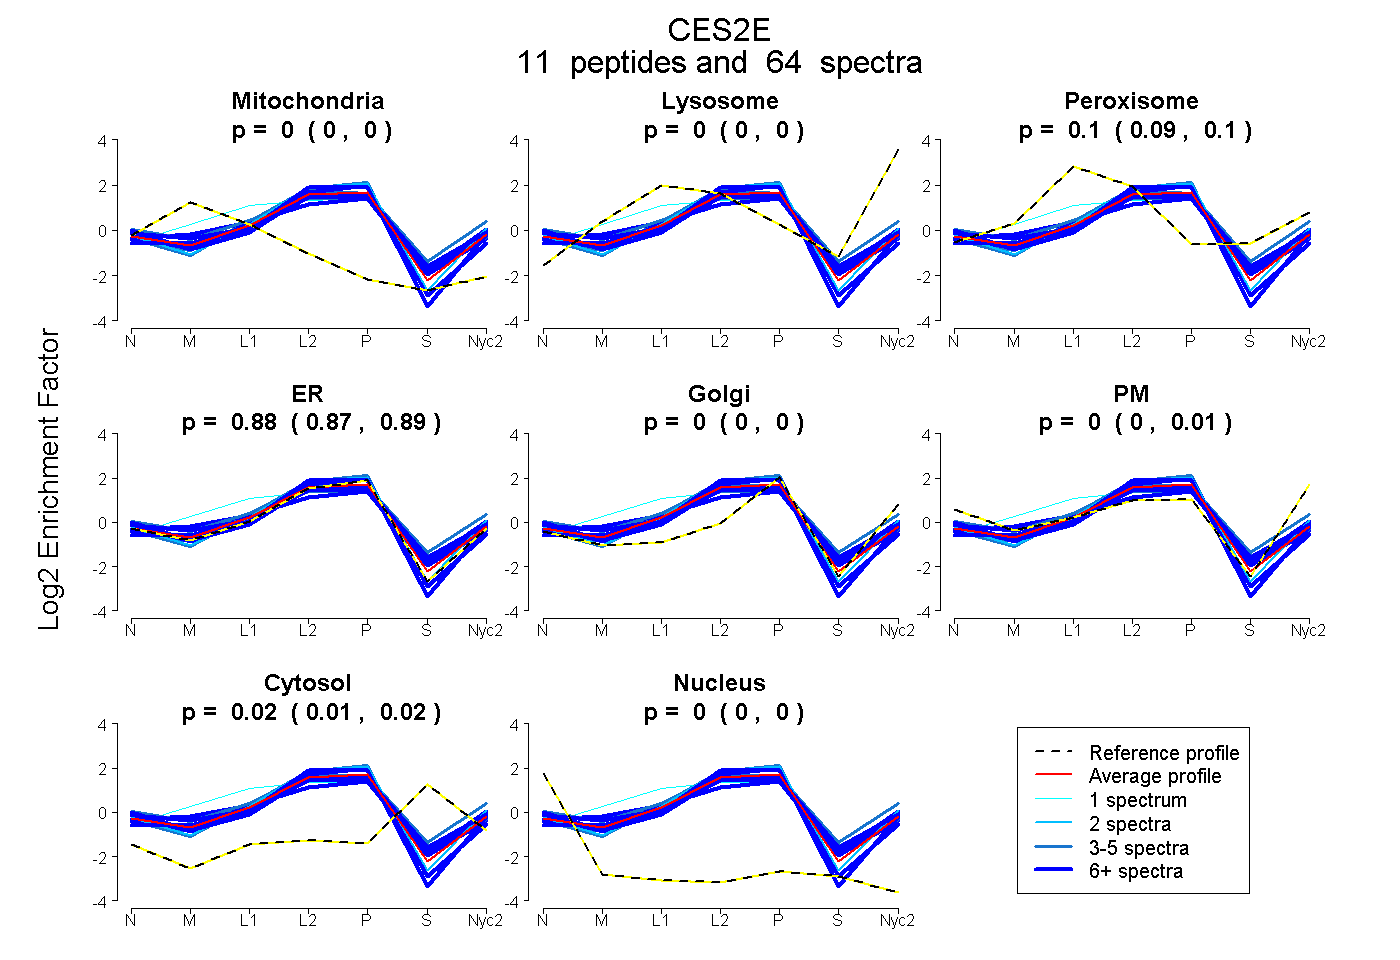
0.000 | 0.000
0.000 | 0.004
0.089 | 0.101
0.872 | 0.888
0.000 | 0.002
0.000 | 0.009
0.015 | 0.025
0.000 | 0.000
| Plot | Mito | Lyso | Perox | ER | Golgi | PM | Cytosol | Nucleus | |||||
| Expt A |
11 peptides |
64 spectra |
|
0.000 0.000 | 0.000 |
0.000 0.000 | 0.004 |
0.096 0.089 | 0.101 |
0.882 0.872 | 0.888 |
0.000 0.000 | 0.002 |
0.002 0.000 | 0.009 |
0.020 0.015 | 0.025 |
0.000 0.000 | 0.000 |
| 9 spectra, WVQQNIVHFGGNPDR | 0.000 | 0.000 | 0.074 | 0.744 | 0.000 | 0.074 | 0.109 | 0.000 | ||
| 2 spectra, SEEEMLAINNIVR | 0.000 | 0.042 | 0.000 | 0.958 | 0.000 | 0.000 | 0.000 | 0.000 | ||
| 9 spectra, GNWGYLDQVAALR | 0.000 | 0.000 | 0.000 | 1.000 | 0.000 | 0.000 | 0.000 | 0.000 | ||
| 5 spectra, DIRPPHVK | 0.000 | 0.000 | 0.000 | 1.000 | 0.000 | 0.000 | 0.000 | 0.000 | ||
| 8 spectra, TISGVVDGK | 0.000 | 0.000 | 0.000 | 1.000 | 0.000 | 0.000 | 0.000 | 0.000 | ||
| 9 spectra, NTHTGQVR | 0.000 | 0.000 | 0.065 | 0.774 | 0.000 | 0.072 | 0.089 | 0.000 | ||
| 4 spectra, FVFTEEEK | 0.000 | 0.142 | 0.083 | 0.695 | 0.000 | 0.000 | 0.080 | 0.000 | ||
| 6 spectra, GSFVHVK | 0.088 | 0.000 | 0.142 | 0.682 | 0.064 | 0.000 | 0.024 | 0.000 | ||
| 1 spectrum, FAPPEPPEPWSGVR | 0.064 | 0.000 | 0.323 | 0.613 | 0.000 | 0.000 | 0.000 | 0.000 | ||
| 3 spectra, GSQDNHTEL | 0.000 | 0.000 | 0.201 | 0.730 | 0.000 | 0.000 | 0.066 | 0.003 | ||
| 8 spectra, LGILGFFSTGDEHAR | 0.000 | 0.000 | 0.119 | 0.683 | 0.000 | 0.137 | 0.061 | 0.000 |
| Plot | Mito | Lyso or Perox | ER | Golgi | PM | Cytosol | Nucleus | ||||||
| Expt B |
7 peptides |
20 spectra |
 |
0.000 0.000 | 0.000 |
0.102 0.091 | 0.111 |
0.898 0.888 | 0.907 |
0.000 0.000 | 0.000 |
0.000 0.000 | 0.000 |
0.000 0.000 | 0.000 |
0.000 0.000 | 0.000 |
|||
| Plot | Lyso | Other | |||||||||||
| Expt C |
10 peptides |
64 spectra |
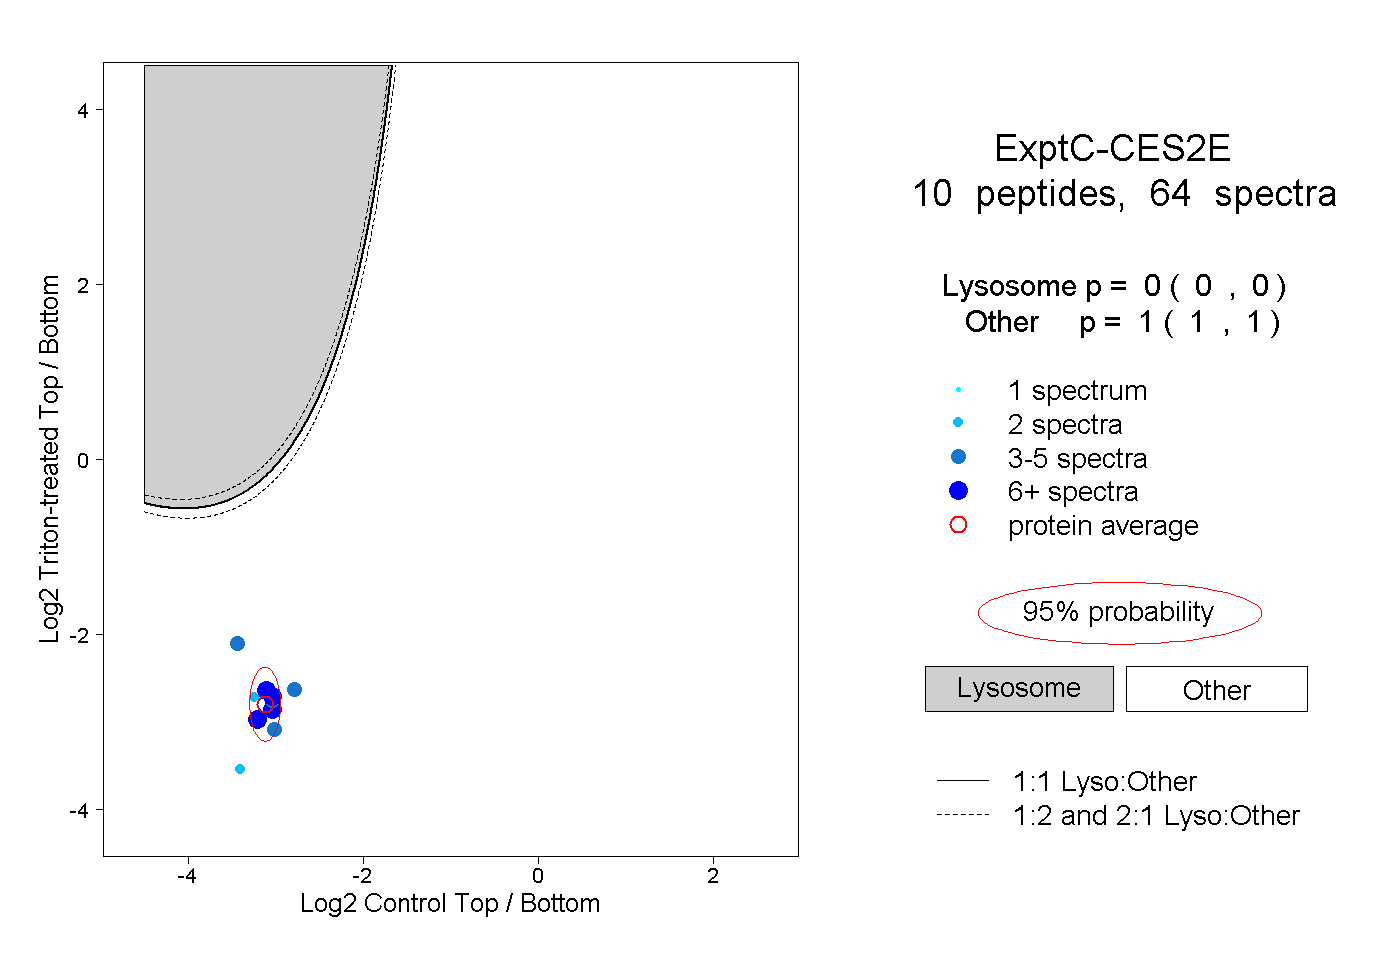 |
0.000 0.000 | 0.000 |
1.000 1.000 | 1.000 |
||||||||
| Plot | Lyso | Other | |||||||||||
| Expt D |
2 peptides |
8 spectra |
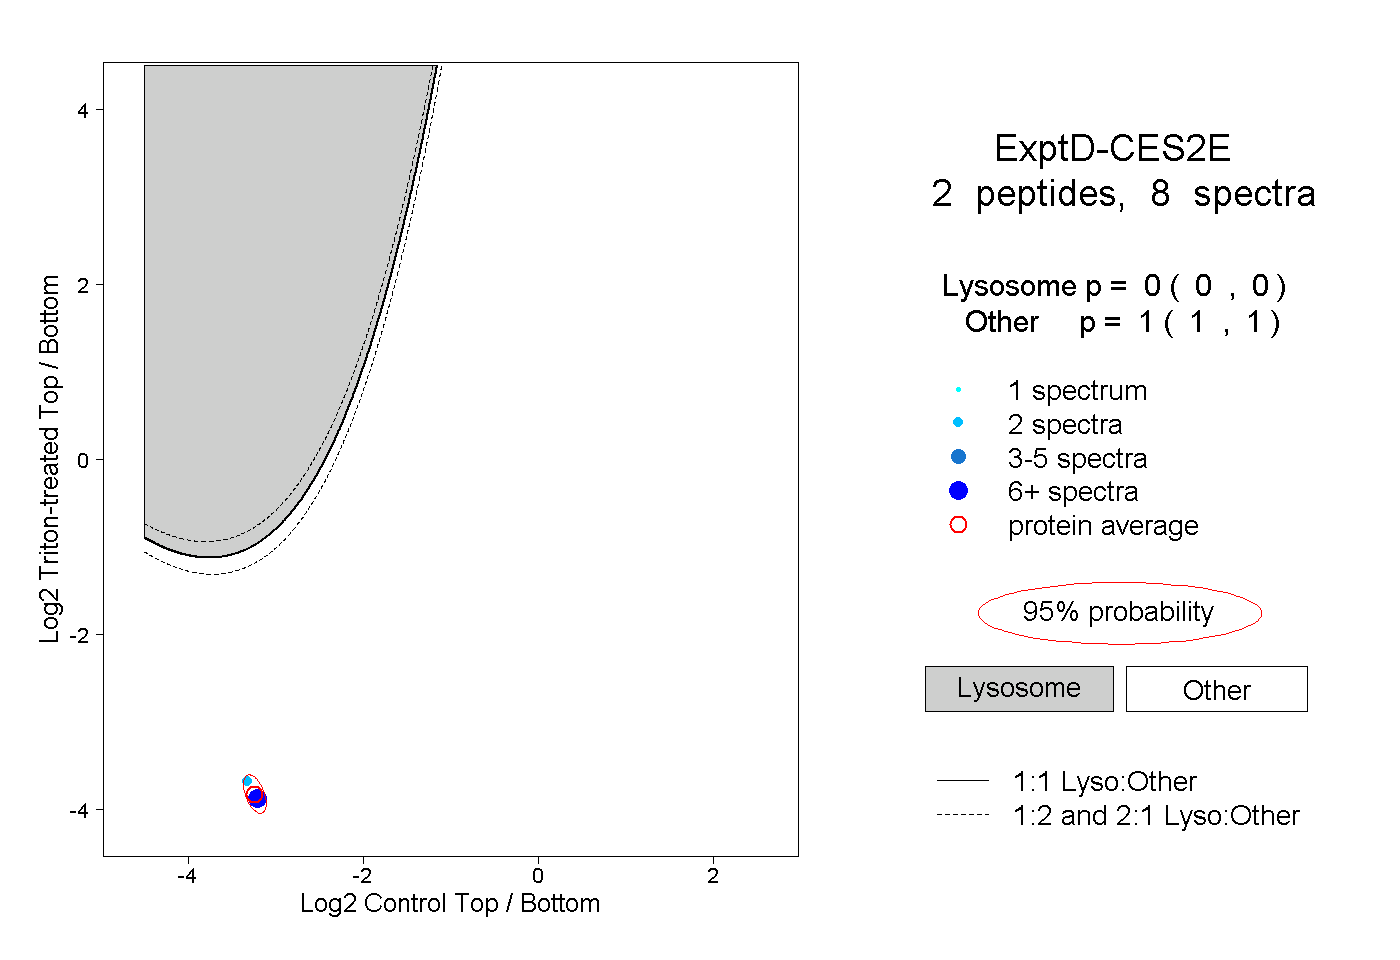 |
0.000 0.000 | 0.000 |
1.000 1.000 | 1.000 |