 4
4peptides
spectra
0.000 | 0.004
0.000 | 0.000
0.000 | 0.055
0.042 | 0.430
0.000 | 0.296
0.000 | 0.000
0.004 | 0.190
0.429 | 0.565
1peptide
spectra
NA | NA
NA | NA
NA | NA
NA | NA
NA | NA
NA | NA
NA | NA
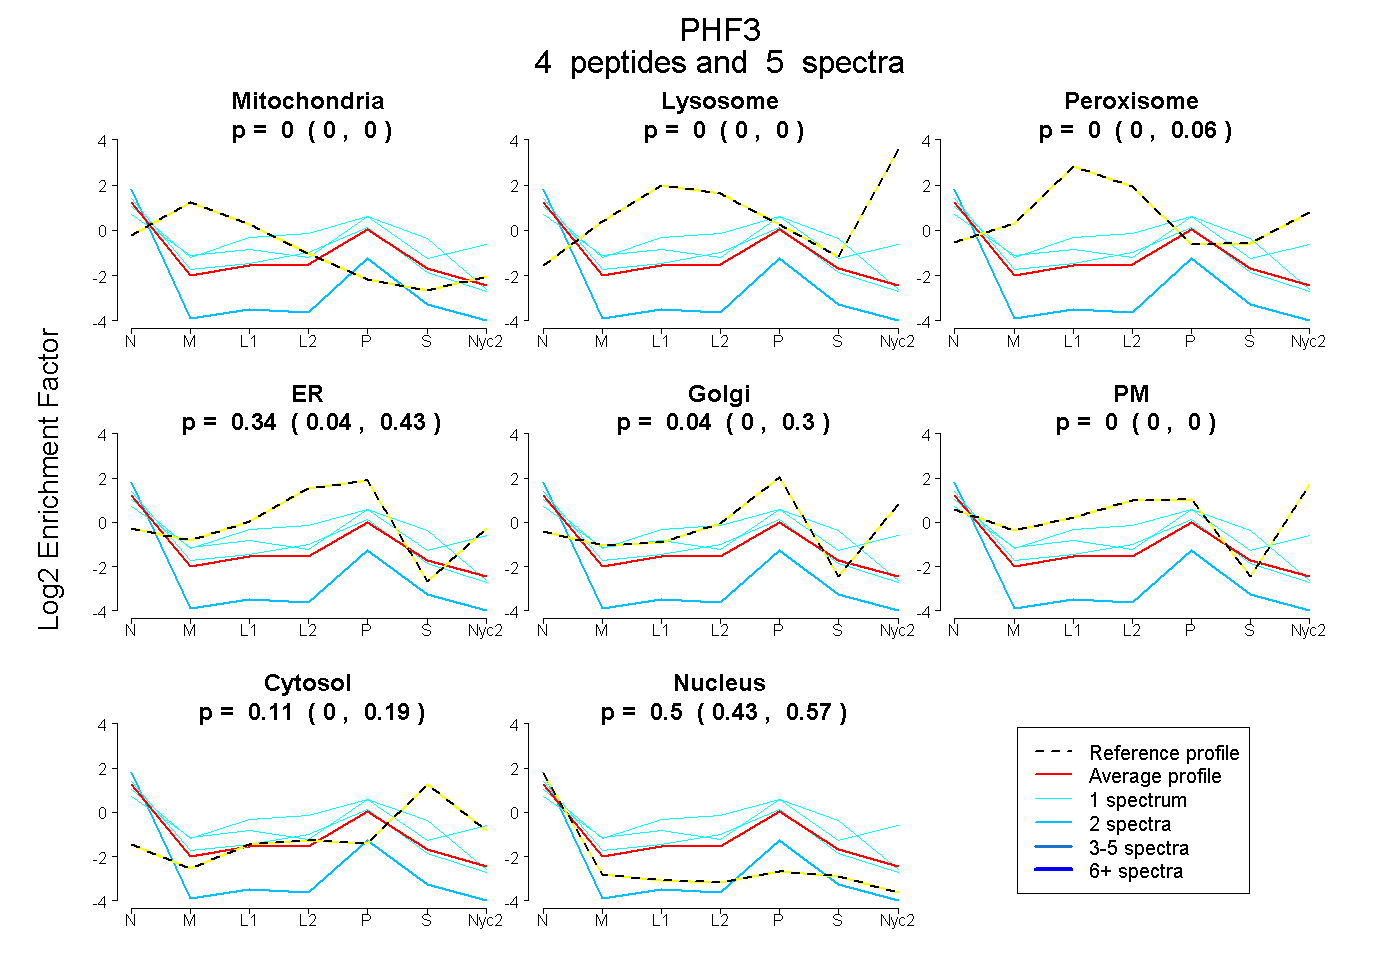
| Plot | Mito | Lyso | Perox | ER | Golgi | PM | Cytosol | Nucleus | |||||
| Expt A |
4 peptides |
5 spectra |
|
0.000 0.000 | 0.004 |
0.000 0.000 | 0.000 |
0.000 0.000 | 0.055 |
0.345 0.042 | 0.430 |
0.038 0.000 | 0.296 |
0.000 0.000 | 0.000 |
0.114 0.004 | 0.190 |
0.503 0.429 | 0.565 |
||
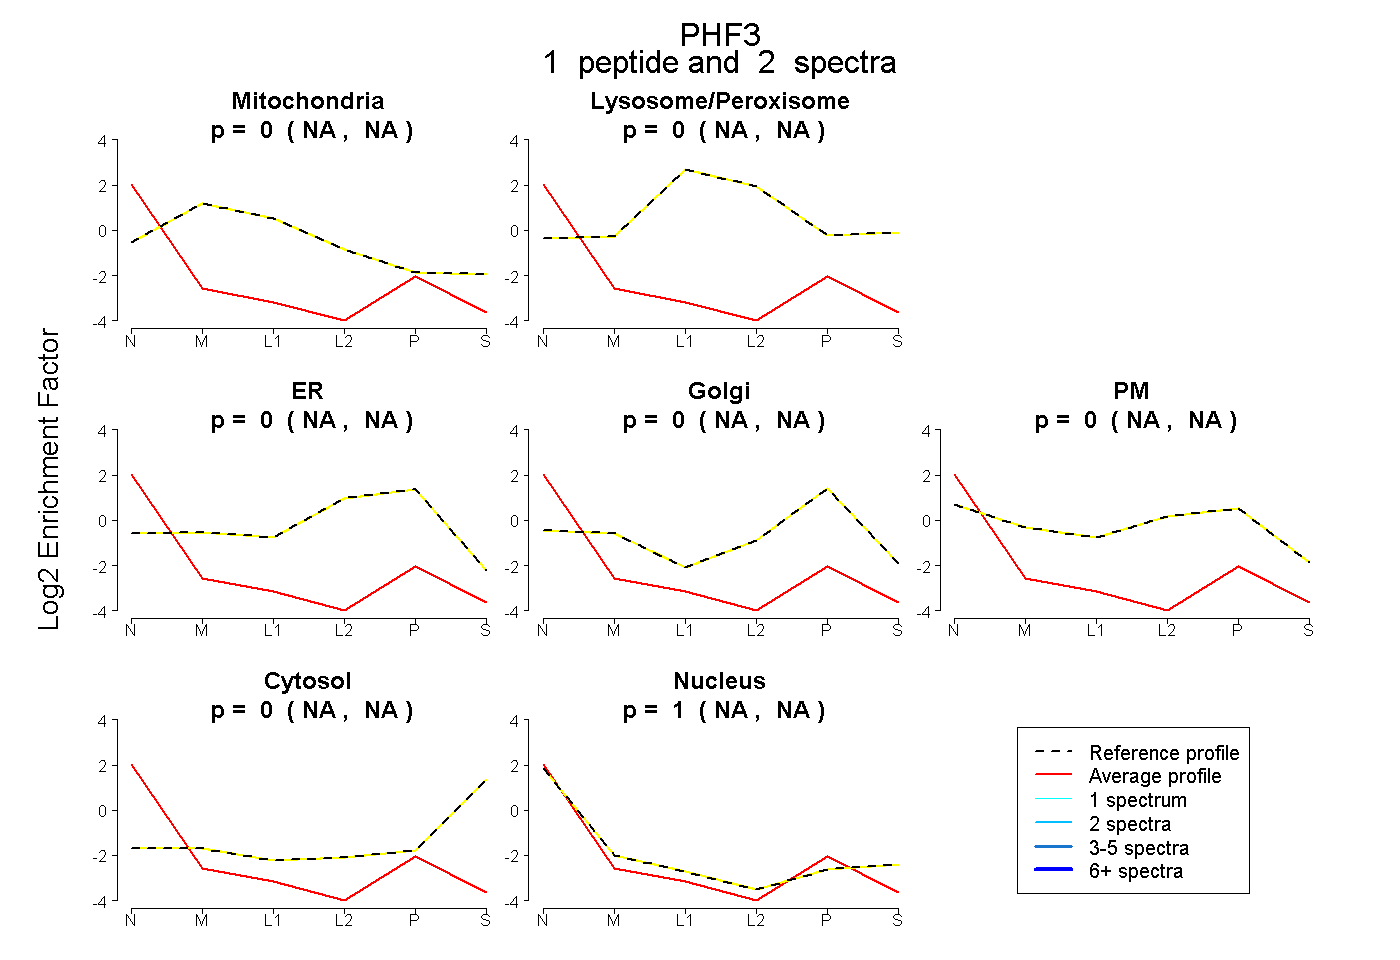
| Plot | Mito | Lyso or Perox | ER | Golgi | PM | Cytosol | Nucleus | ||||||
| Expt B |
1 peptide |
2 spectra |
|
0.000 NA | NA |
0.000 NA | NA |
0.000 NA | NA |
0.000 NA | NA |
0.000 NA | NA |
0.000 NA | NA |
1.000 NA | NA |