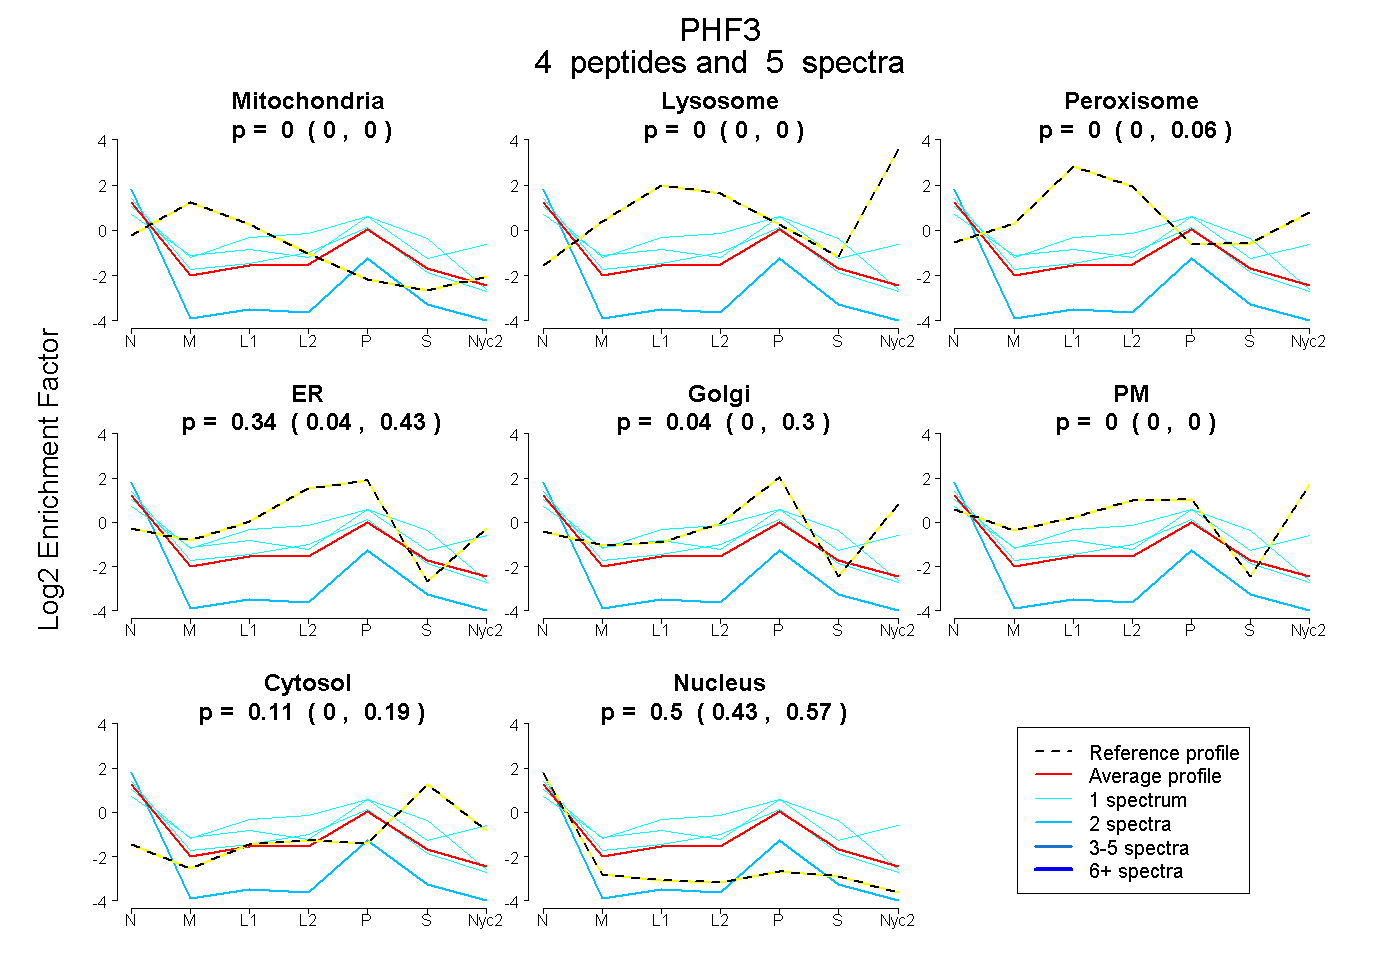
 4
4peptides
spectra
0.000 | 0.004
0.000 | 0.000
0.000 | 0.055
0.042 | 0.430
0.000 | 0.296
0.000 | 0.000
0.004 | 0.190
0.429 | 0.565
| Plot | Mito | Lyso | Perox | ER | Golgi | PM | Cytosol | Nucleus | |||||
| Expt A |
4 peptides |
5 spectra |
|
0.000 0.000 | 0.004 |
0.000 0.000 | 0.000 |
0.000 0.000 | 0.055 |
0.345 0.042 | 0.430 |
0.038 0.000 | 0.296 |
0.000 0.000 | 0.000 |
0.114 0.004 | 0.190 |
0.503 0.429 | 0.565 |
| 1 spectrum, LEQESEEIK | 0.000 | 0.000 | 0.000 | 0.451 | 0.000 | 0.000 | 0.043 | 0.506 | ||
| 1 spectrum, EGSDQTTSVENK | 0.000 | 0.000 | 0.079 | 0.260 | 0.000 | 0.311 | 0.147 | 0.203 | ||
| 1 spectrum, ISPQTVWDYVEK | 0.064 | 0.000 | 0.000 | 0.362 | 0.000 | 0.000 | 0.318 | 0.256 | ||
| 2 spectra, ELFSFFR | 0.000 | 0.000 | 0.000 | 0.000 | 0.005 | 0.000 | 0.000 | 0.995 |
| Plot | Mito | Lyso or Perox | ER | Golgi | PM | Cytosol | Nucleus | ||||||
| Expt B |
1 peptide |
2 spectra |
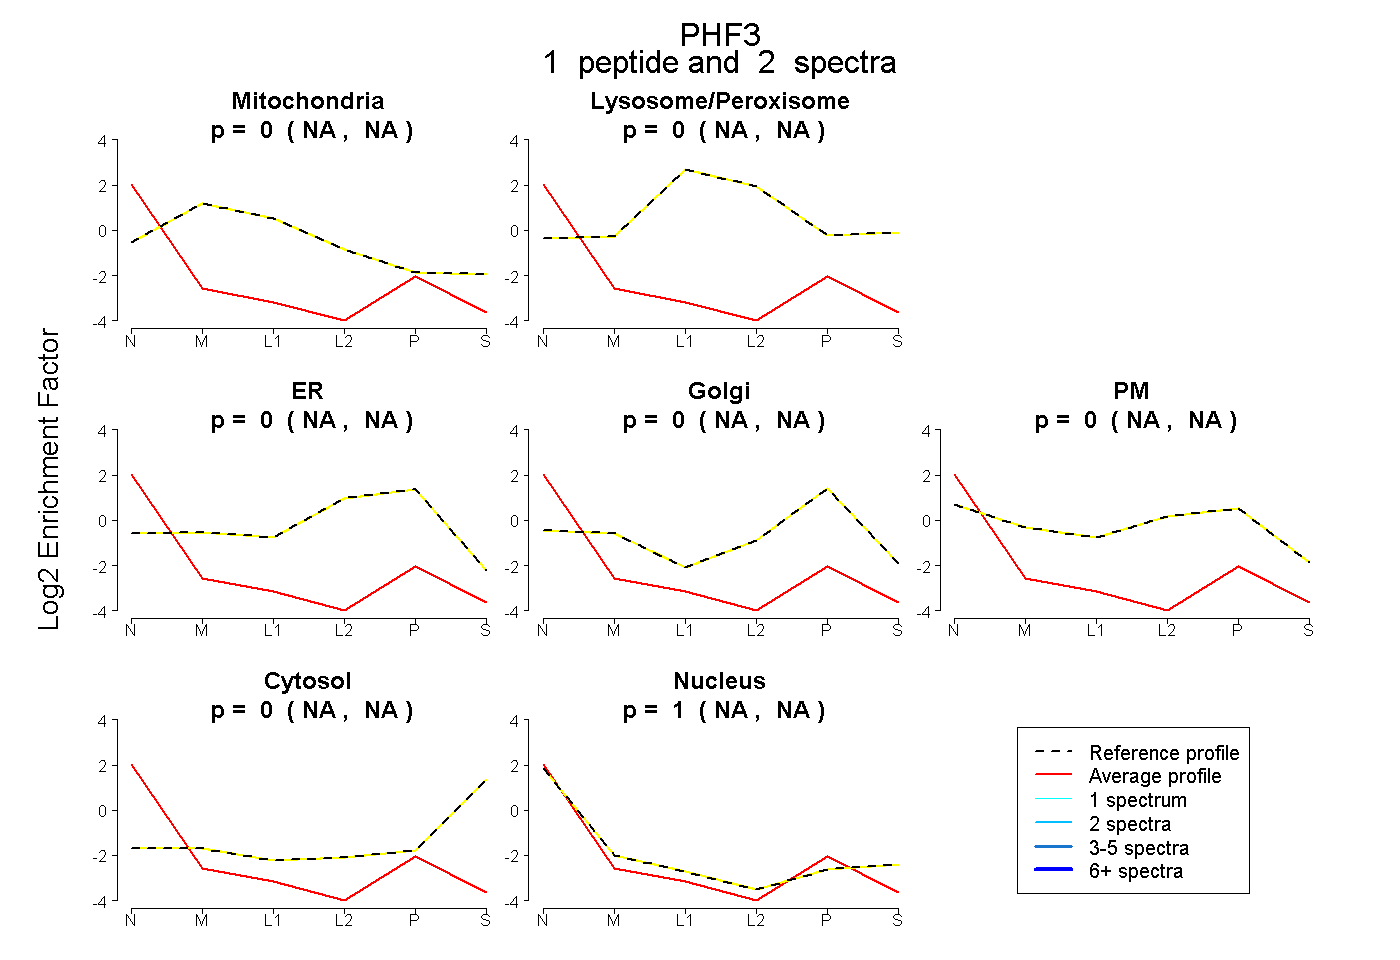 |
0.000 NA | NA |
0.000 NA | NA |
0.000 NA | NA |
0.000 NA | NA |
0.000 NA | NA |
0.000 NA | NA |
1.000 NA | NA |