 14
14peptides
spectra
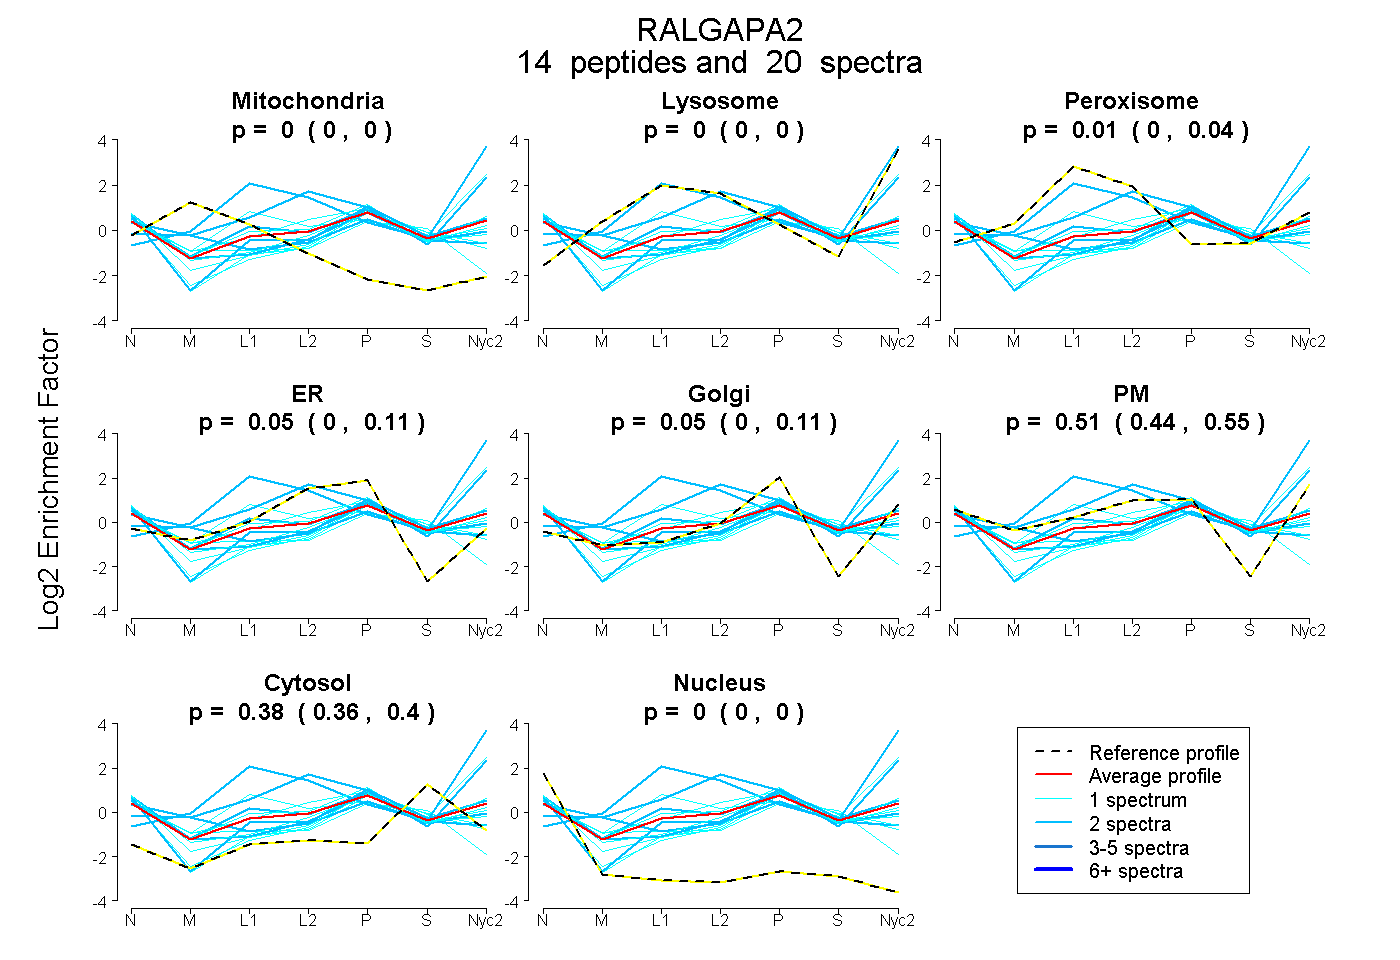
0.000 | 0.000
0.000 | 0.000
0.000 | 0.044
0.000 | 0.106
0.000 | 0.109
0.439 | 0.553
0.364 | 0.396
0.000 | 0.000
3peptides
spectra
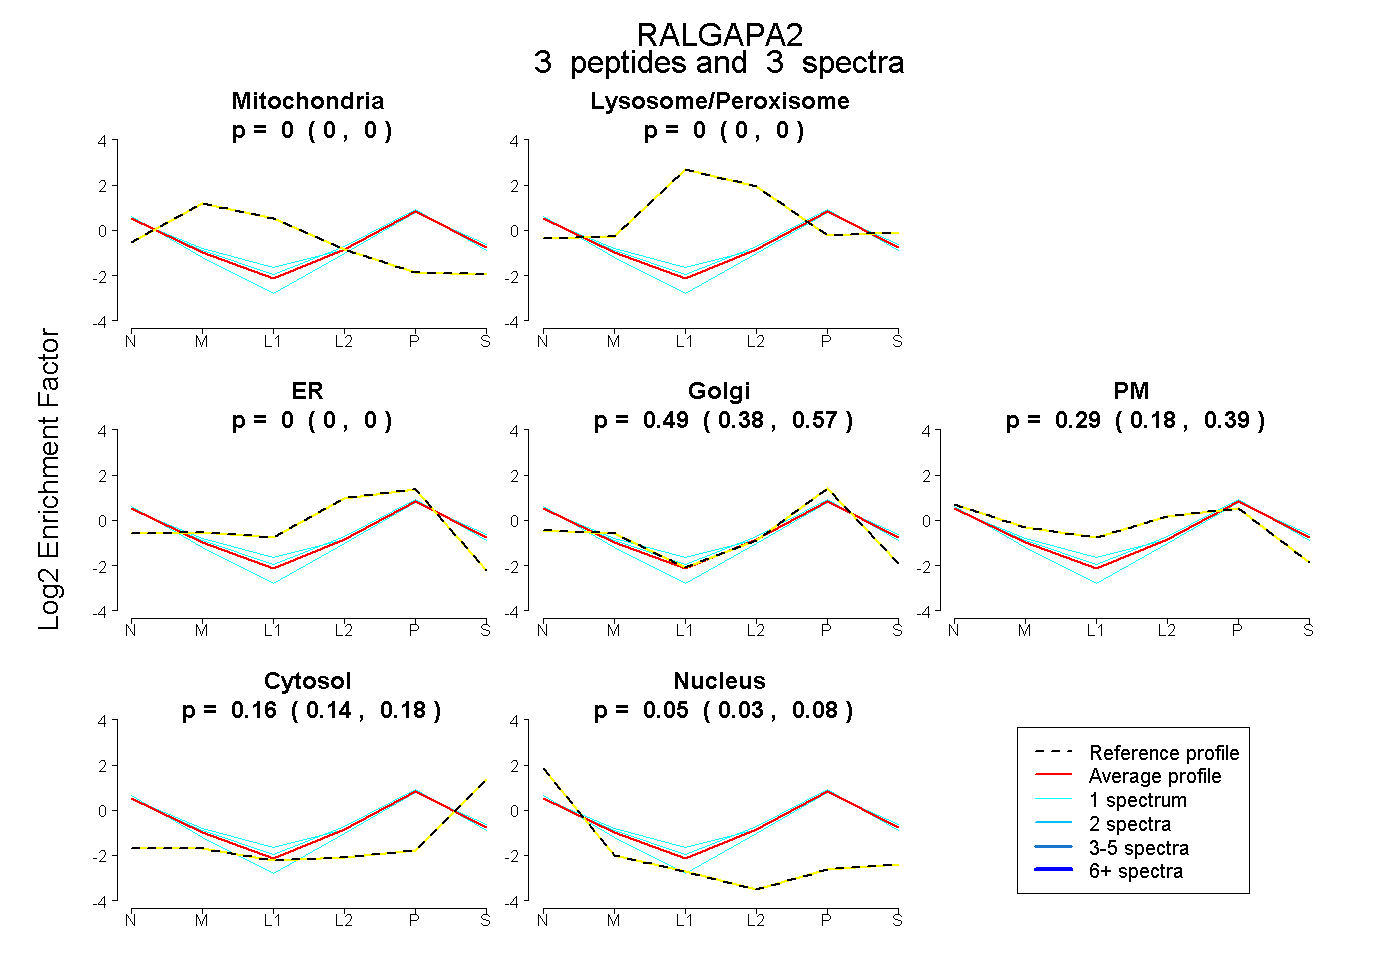
0.000 | 0.000
0.000 | 0.000
0.000 | 0.000
0.381 | 0.573
0.182 | 0.393
0.142 | 0.180
0.029 | 0.076
4peptides
spectra
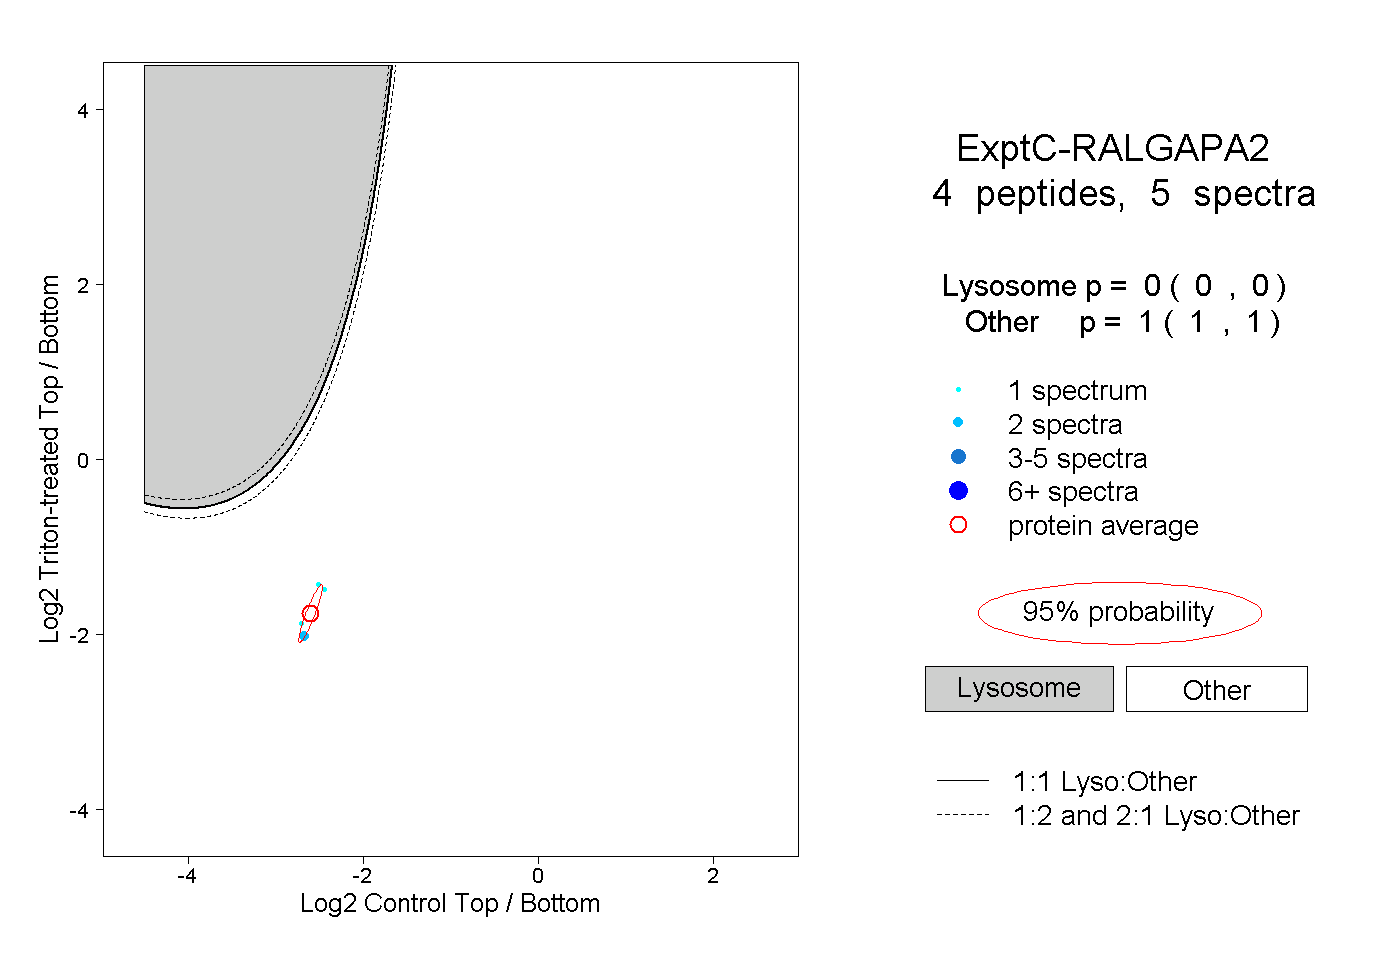
0.000 | 0.000
1.000 | 1.000
2peptides
spectra
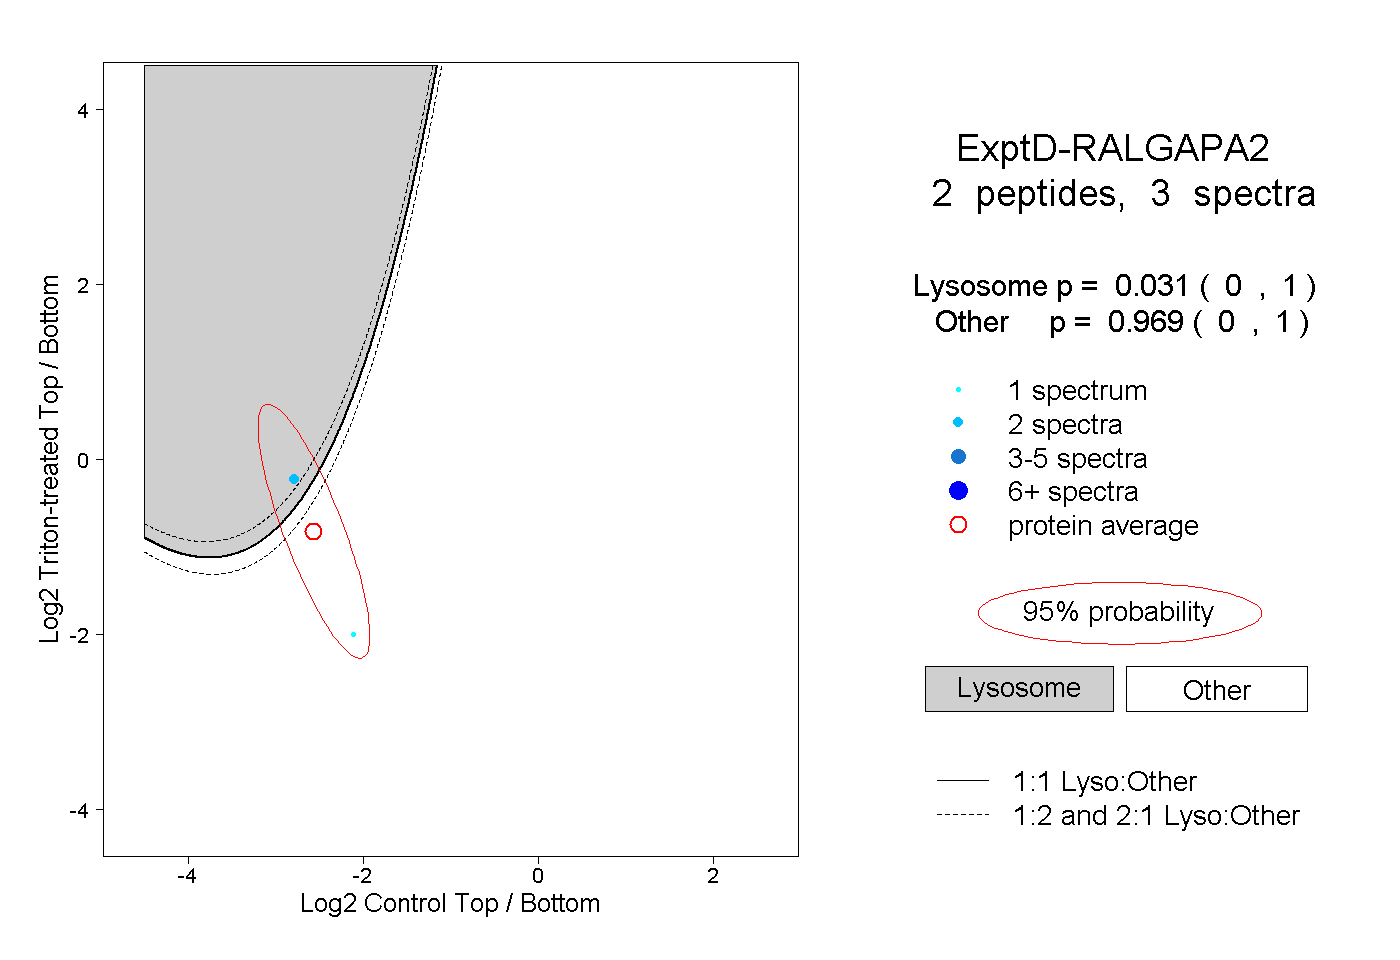
0.000 | 1.000
0.000 | 1.000