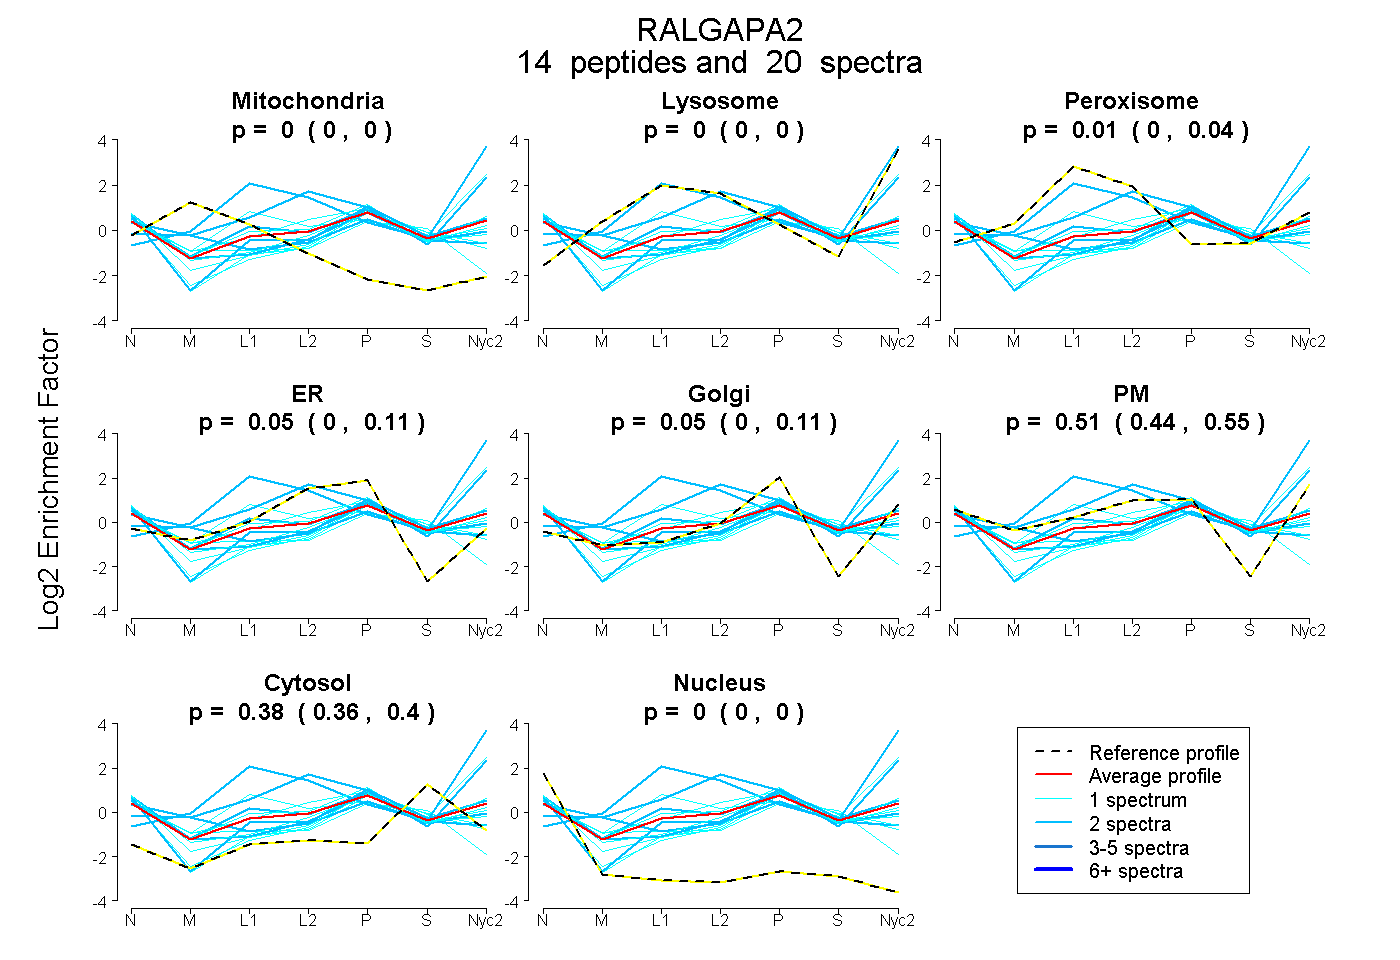
 14
14peptides
spectra
0.000 | 0.000
0.000 | 0.000
0.000 | 0.044
0.000 | 0.106
0.000 | 0.109
0.439 | 0.553
0.364 | 0.396
0.000 | 0.000
| Plot | Mito | Lyso | Perox | ER | Golgi | PM | Cytosol | Nucleus | |||||
| Expt A |
14 peptides |
20 spectra |
|
0.000 0.000 | 0.000 |
0.000 0.000 | 0.000 |
0.009 0.000 | 0.044 |
0.046 0.000 | 0.106 |
0.052 0.000 | 0.109 |
0.509 0.439 | 0.553 |
0.384 0.364 | 0.396 |
0.000 0.000 | 0.000 |
| 2 spectra, EIIEVILR | 0.000 | 0.000 | 0.224 | 0.251 | 0.193 | 0.000 | 0.247 | 0.085 | ||
| 1 spectrum, SFSLSWR | 0.000 | 0.000 | 0.073 | 0.126 | 0.179 | 0.314 | 0.308 | 0.000 | ||
| 2 spectra, HYLINILLK | 0.148 | 0.000 | 0.000 | 0.000 | 0.203 | 0.317 | 0.332 | 0.000 | ||
| 1 spectrum, QSTQEDEYVQR | 0.000 | 0.000 | 0.000 | 0.000 | 0.327 | 0.221 | 0.346 | 0.106 | ||
| 1 spectrum, GPFYFCR | 0.106 | 0.000 | 0.000 | 0.335 | 0.000 | 0.000 | 0.443 | 0.115 | ||
| 1 spectrum, IYPEEITPLLPAVSGEK | 0.000 | 0.000 | 0.042 | 0.264 | 0.000 | 0.362 | 0.332 | 0.000 | ||
| 2 spectra, IPYMAAR | 0.000 | 0.907 | 0.040 | 0.000 | 0.000 | 0.016 | 0.037 | 0.000 | ||
| 2 spectra, ILLSTR | 0.000 | 0.000 | 0.000 | 0.000 | 0.257 | 0.328 | 0.330 | 0.085 | ||
| 1 spectrum, EELDSILFLFEK | 0.000 | 0.351 | 0.000 | 0.000 | 0.000 | 0.416 | 0.233 | 0.000 | ||
| 1 spectrum, AVLIIFR | 0.000 | 0.000 | 0.000 | 0.123 | 0.333 | 0.000 | 0.434 | 0.111 | ||
| 1 spectrum, ELWDDFLR | 0.000 | 0.000 | 0.000 | 0.077 | 0.332 | 0.032 | 0.448 | 0.111 | ||
| 1 spectrum, VTSQGQPSPVEPR | 0.000 | 0.000 | 0.000 | 0.000 | 0.186 | 0.446 | 0.337 | 0.032 | ||
| 2 spectra, SSSTSDITER | 0.000 | 0.000 | 0.000 | 0.000 | 0.285 | 0.292 | 0.422 | 0.001 | ||
| 2 spectra, SLAGLLFR | 0.000 | 0.424 | 0.027 | 0.029 | 0.000 | 0.433 | 0.088 | 0.000 |
| Plot | Mito | Lyso or Perox | ER | Golgi | PM | Cytosol | Nucleus | ||||||
| Expt B |
3 peptides |
3 spectra |
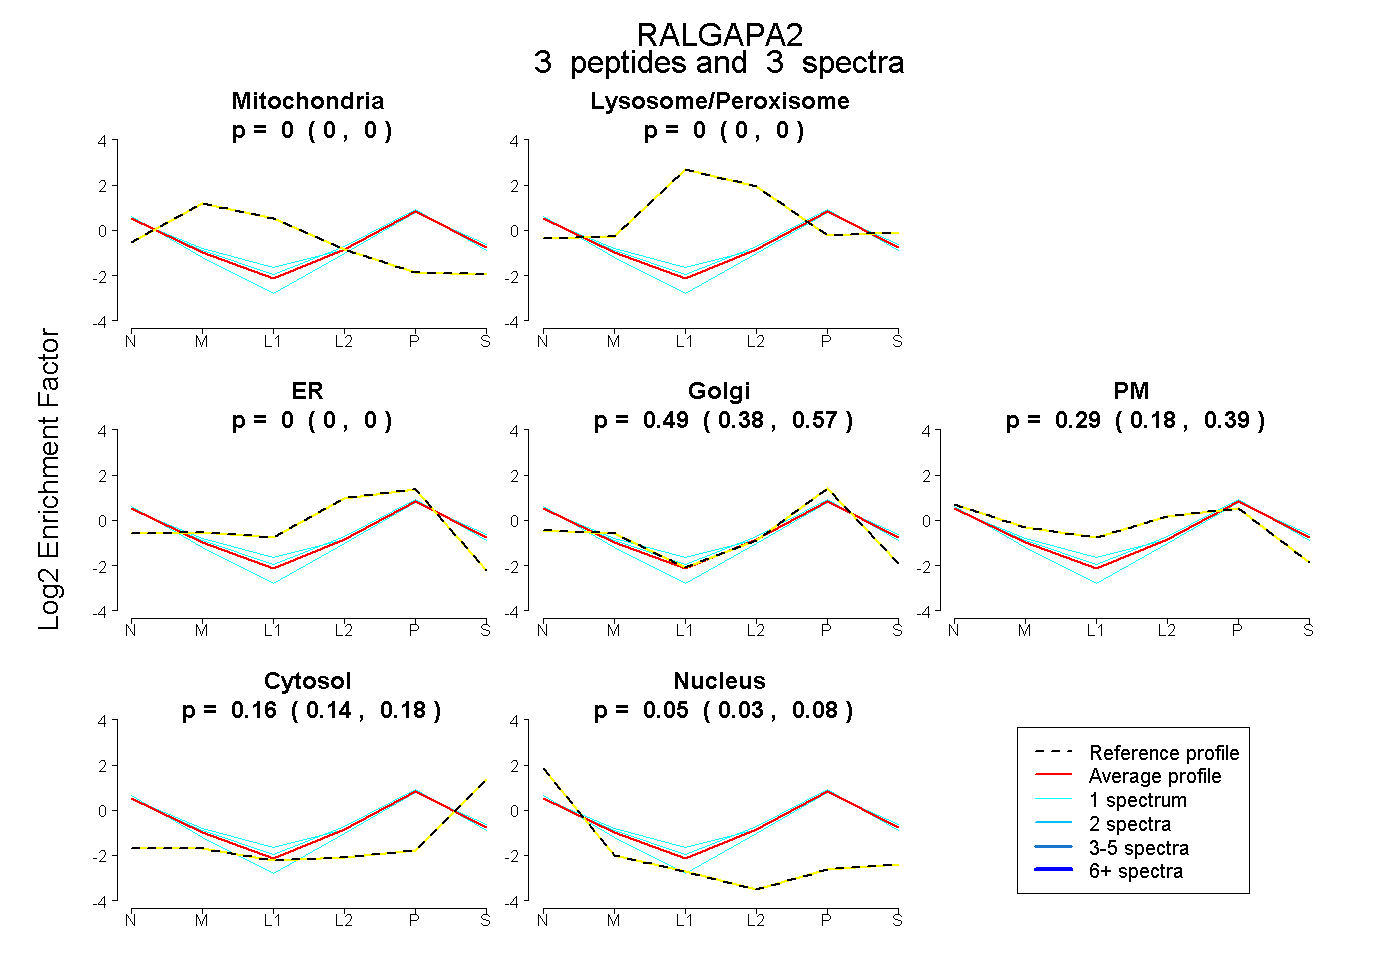 |
0.000 0.000 | 0.000 |
0.000 0.000 | 0.000 |
0.000 0.000 | 0.000 |
0.488 0.381 | 0.573 |
0.295 0.182 | 0.393 |
0.163 0.142 | 0.180 |
0.055 0.029 | 0.076 |
|||
| Plot | Lyso | Other | |||||||||||
| Expt C |
4 peptides |
5 spectra |
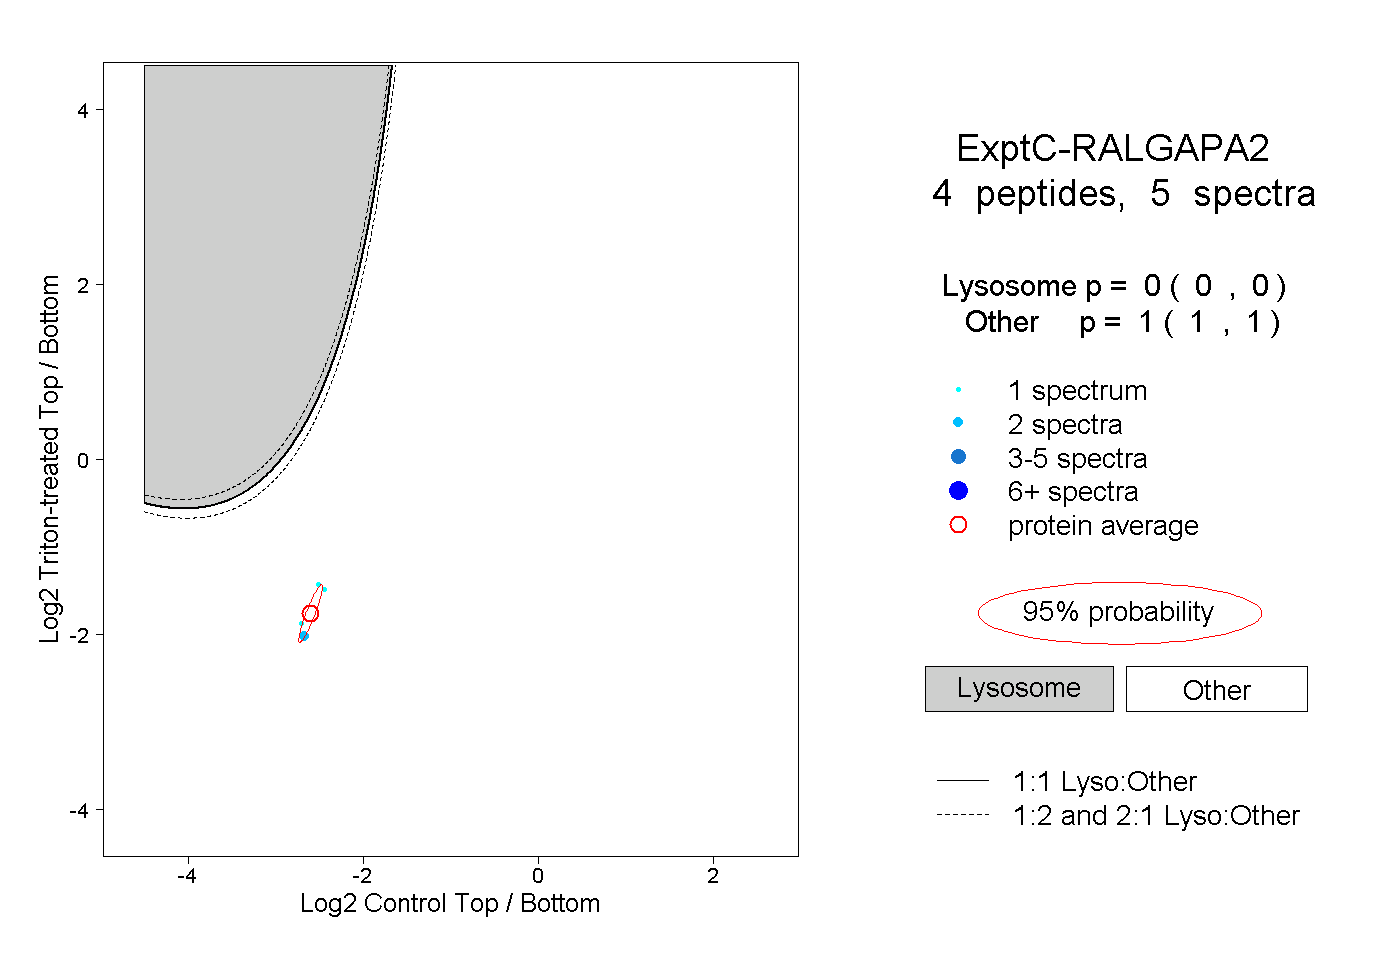 |
0.000 0.000 | 0.000 |
1.000 1.000 | 1.000 |
||||||||
| Plot | Lyso | Other | |||||||||||
| Expt D |
2 peptides |
3 spectra |
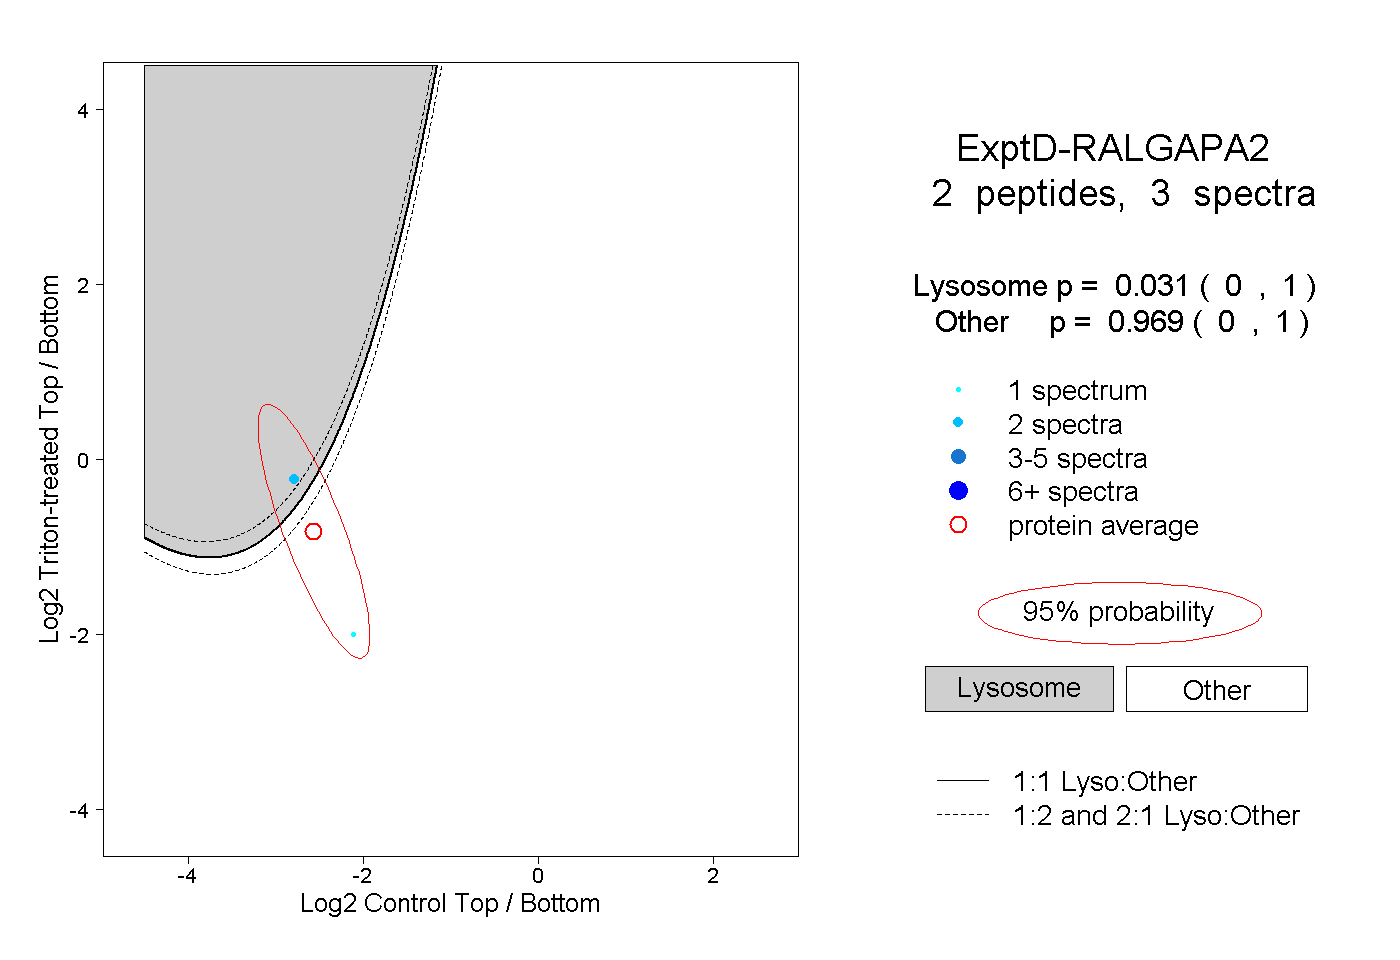 |
0.031 0.000 | 1.000 |
0.969 0.000 | 1.000 |