 9
9peptides
spectra

0.000 | 0.000
0.000 | 0.000
0.125 | 0.158
0.039 | 0.113
0.000 | 0.000
0.280 | 0.364
0.440 | 0.461
0.000 | 0.000
5peptides
spectra
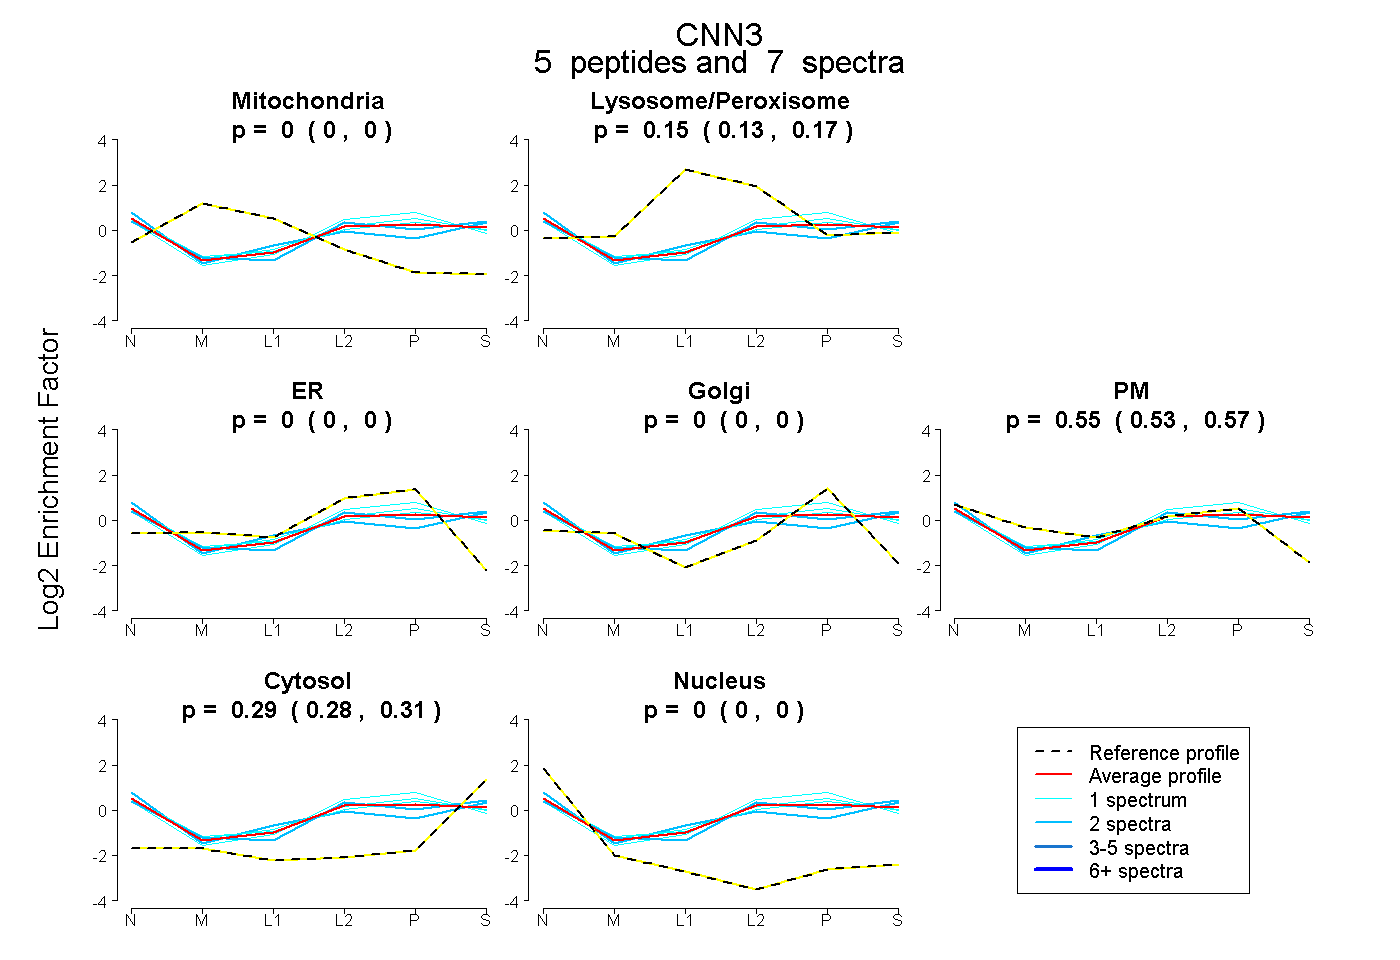
0.000 | 0.000
0.132 | 0.167
0.000 | 0.000
0.000 | 0.000
0.527 | 0.575
0.279 | 0.309
0.000 | 0.000
8peptides
spectra
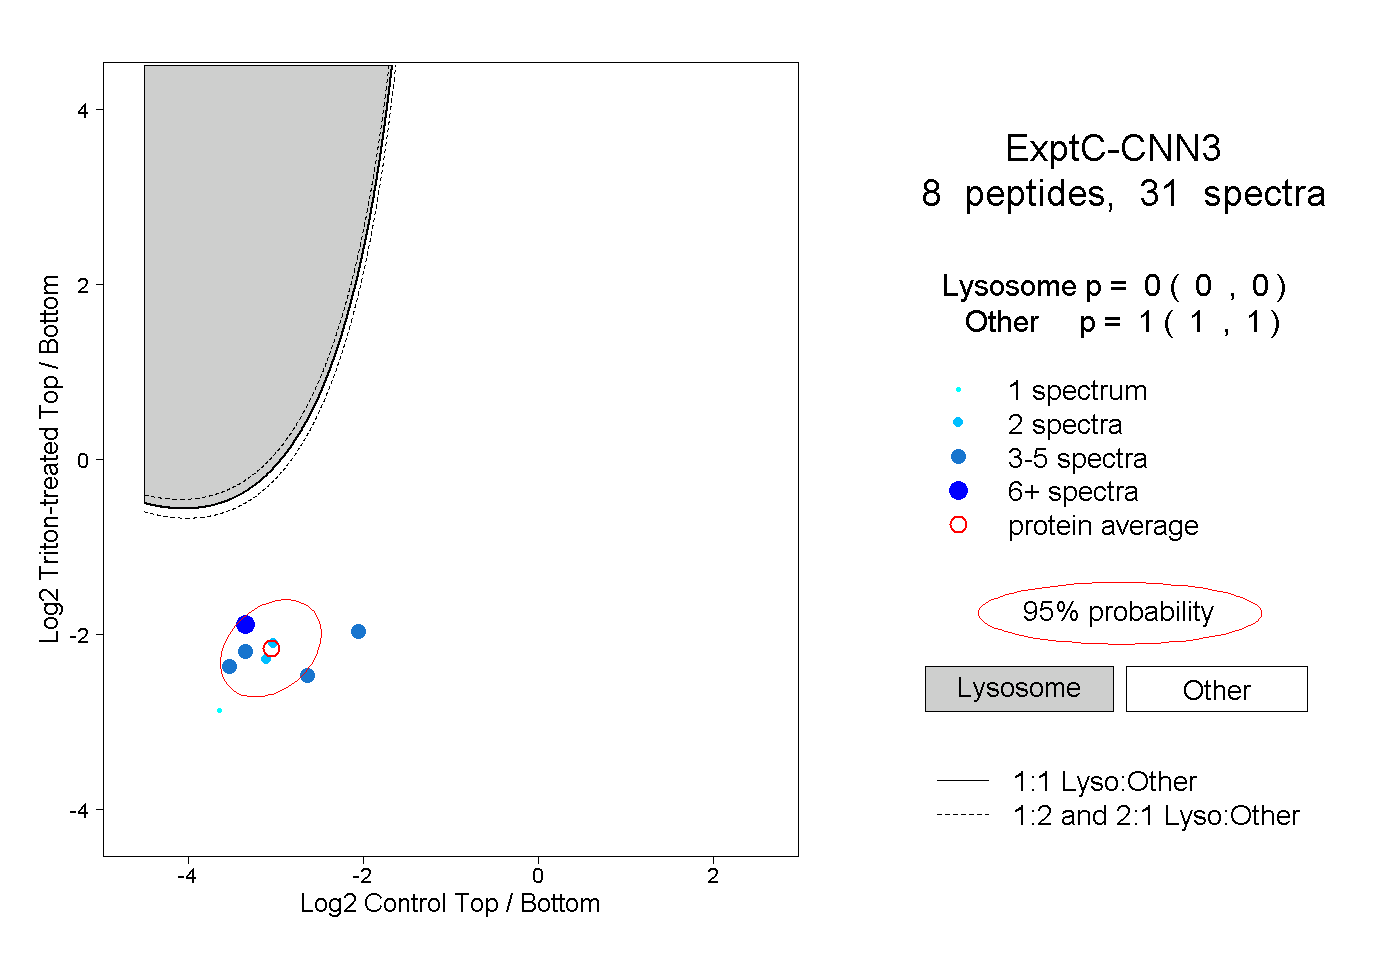
0.000 | 0.000
1.000 | 1.000
5peptides
spectra
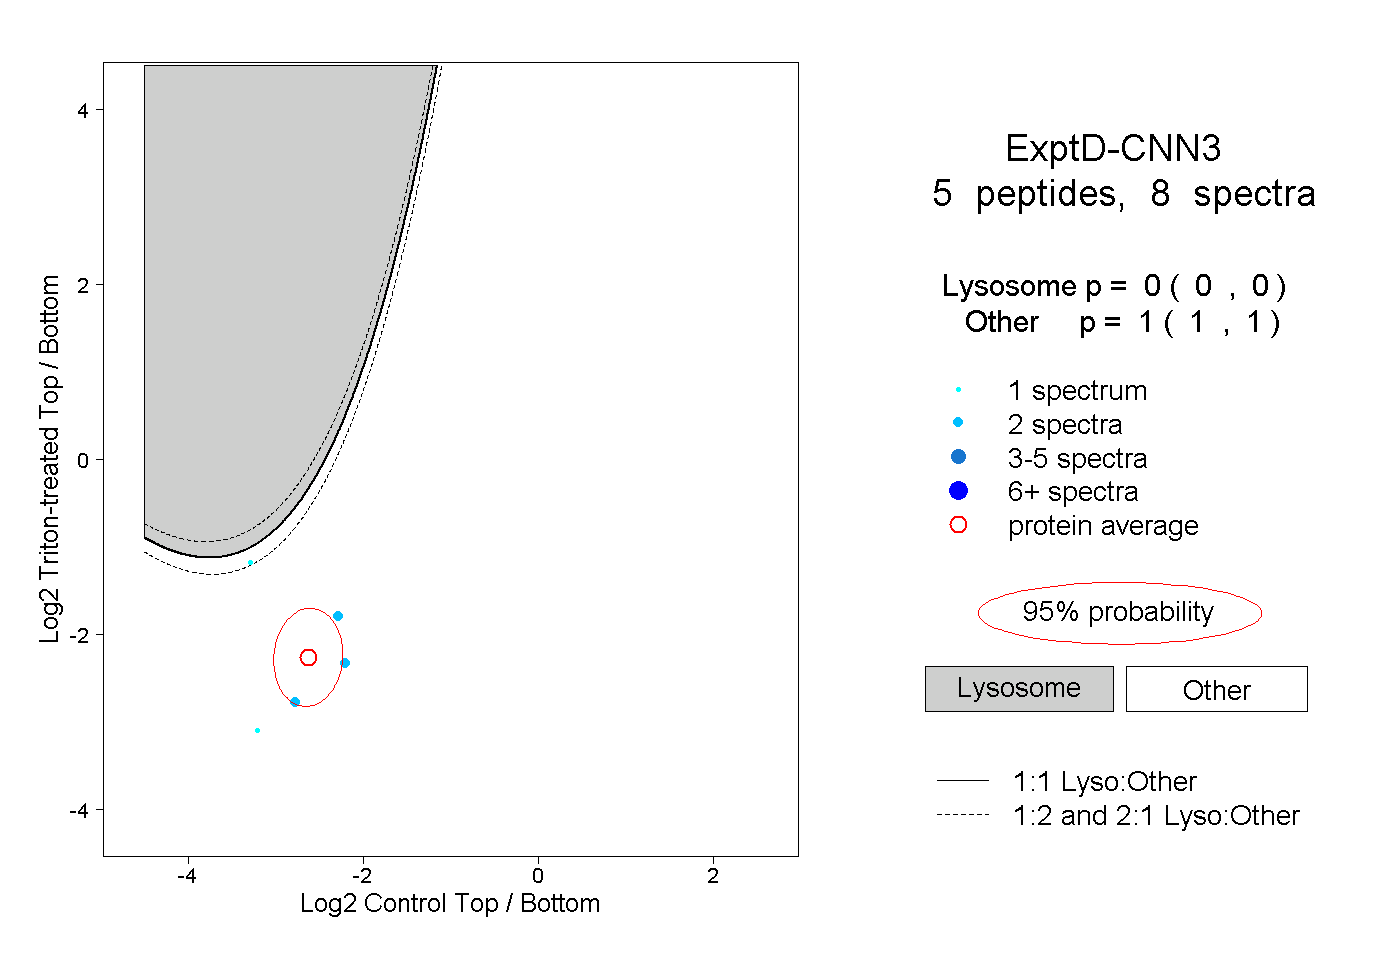
0.000 | 0.000
1.000 | 1.000