 9
9peptides
spectra

0.000 | 0.000
0.000 | 0.000
0.125 | 0.158
0.039 | 0.113
0.000 | 0.000
0.280 | 0.364
0.440 | 0.461
0.000 | 0.000
| Plot | Mito | Lyso | Perox | ER | Golgi | PM | Cytosol | Nucleus | |||||
| Expt A |
9 peptides |
16 spectra |
|
0.000 0.000 | 0.000 |
0.000 0.000 | 0.000 |
0.142 0.125 | 0.158 |
0.079 0.039 | 0.113 |
0.000 0.000 | 0.000 |
0.327 0.280 | 0.364 |
0.452 0.440 | 0.461 |
0.000 0.000 | 0.000 |
| 1 spectrum, CASQAGMTAYGTR | 0.000 | 0.000 | 0.122 | 0.000 | 0.000 | 0.500 | 0.378 | 0.000 | ||
| 4 spectra, DGIILCELINK | 0.000 | 0.000 | 0.170 | 0.300 | 0.000 | 0.000 | 0.423 | 0.107 | ||
| 1 spectrum, GMSVYGLGR | 0.000 | 0.000 | 0.288 | 0.000 | 0.170 | 0.247 | 0.278 | 0.017 | ||
| 1 spectrum, DIYDQK | 0.000 | 0.000 | 0.138 | 0.059 | 0.000 | 0.294 | 0.510 | 0.000 | ||
| 2 spectra, GASQAGMSAPGTR | 0.000 | 0.000 | 0.173 | 0.369 | 0.000 | 0.025 | 0.433 | 0.000 | ||
| 1 spectrum, EYQYGDDQGIDY | 0.000 | 0.000 | 0.239 | 0.000 | 0.000 | 0.388 | 0.374 | 0.000 | ||
| 1 spectrum, AGQSVIGLQMGTNK | 0.000 | 0.000 | 0.005 | 0.177 | 0.000 | 0.273 | 0.546 | 0.000 | ||
| 2 spectra, HLYDPK | 0.000 | 0.000 | 0.149 | 0.000 | 0.000 | 0.467 | 0.384 | 0.000 | ||
| 3 spectra, YDQQAEEDLR | 0.000 | 0.000 | 0.150 | 0.000 | 0.000 | 0.372 | 0.478 | 0.000 |
| Plot | Mito | Lyso or Perox | ER | Golgi | PM | Cytosol | Nucleus | ||||||
| Expt B |
5 peptides |
7 spectra |
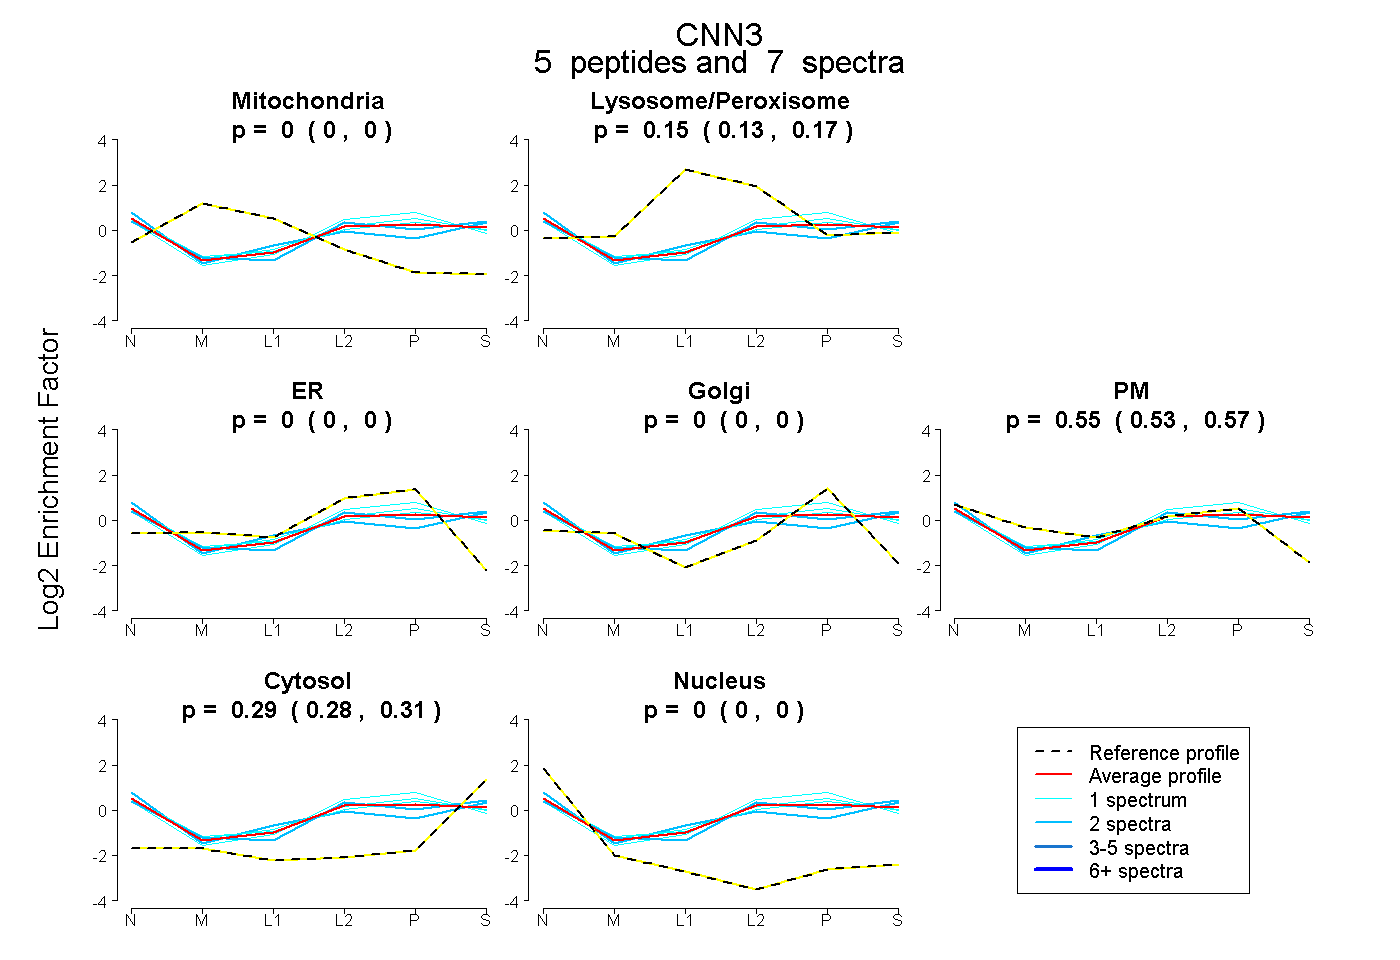 |
0.000 0.000 | 0.000 |
0.150 0.132 | 0.167 |
0.000 0.000 | 0.000 |
0.000 0.000 | 0.000 |
0.555 0.527 | 0.575 |
0.295 0.279 | 0.309 |
0.000 0.000 | 0.000 |
|||
| Plot | Lyso | Other | |||||||||||
| Expt C |
8 peptides |
31 spectra |
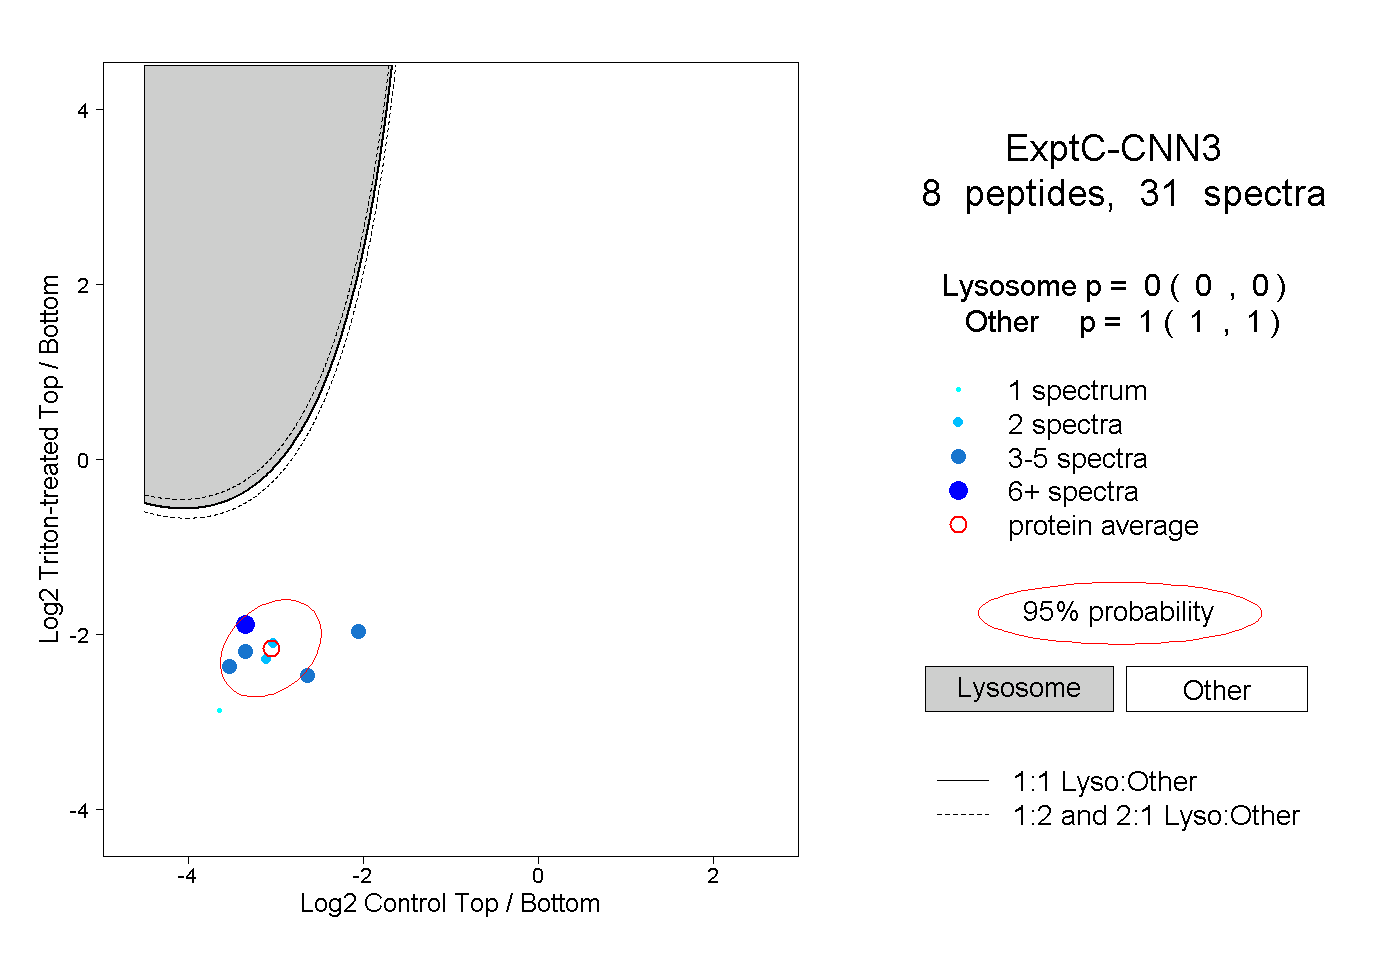 |
0.000 0.000 | 0.000 |
1.000 1.000 | 1.000 |
||||||||
| Plot | Lyso | Other | |||||||||||
| Expt D |
5 peptides |
8 spectra |
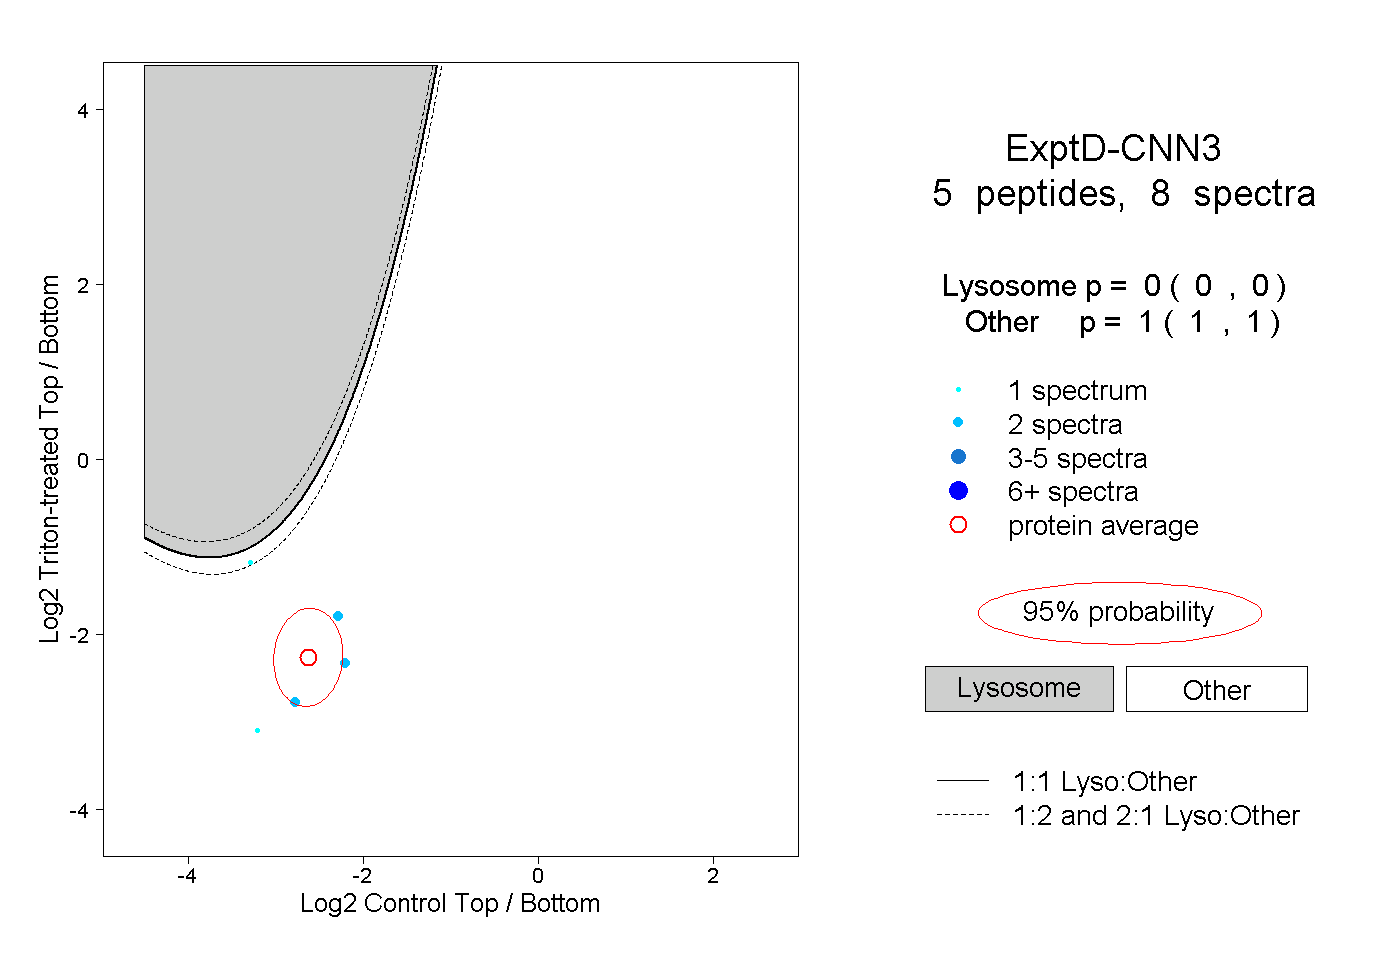 |
0.000 0.000 | 0.000 |
1.000 1.000 | 1.000 |