 8
8peptides
spectra
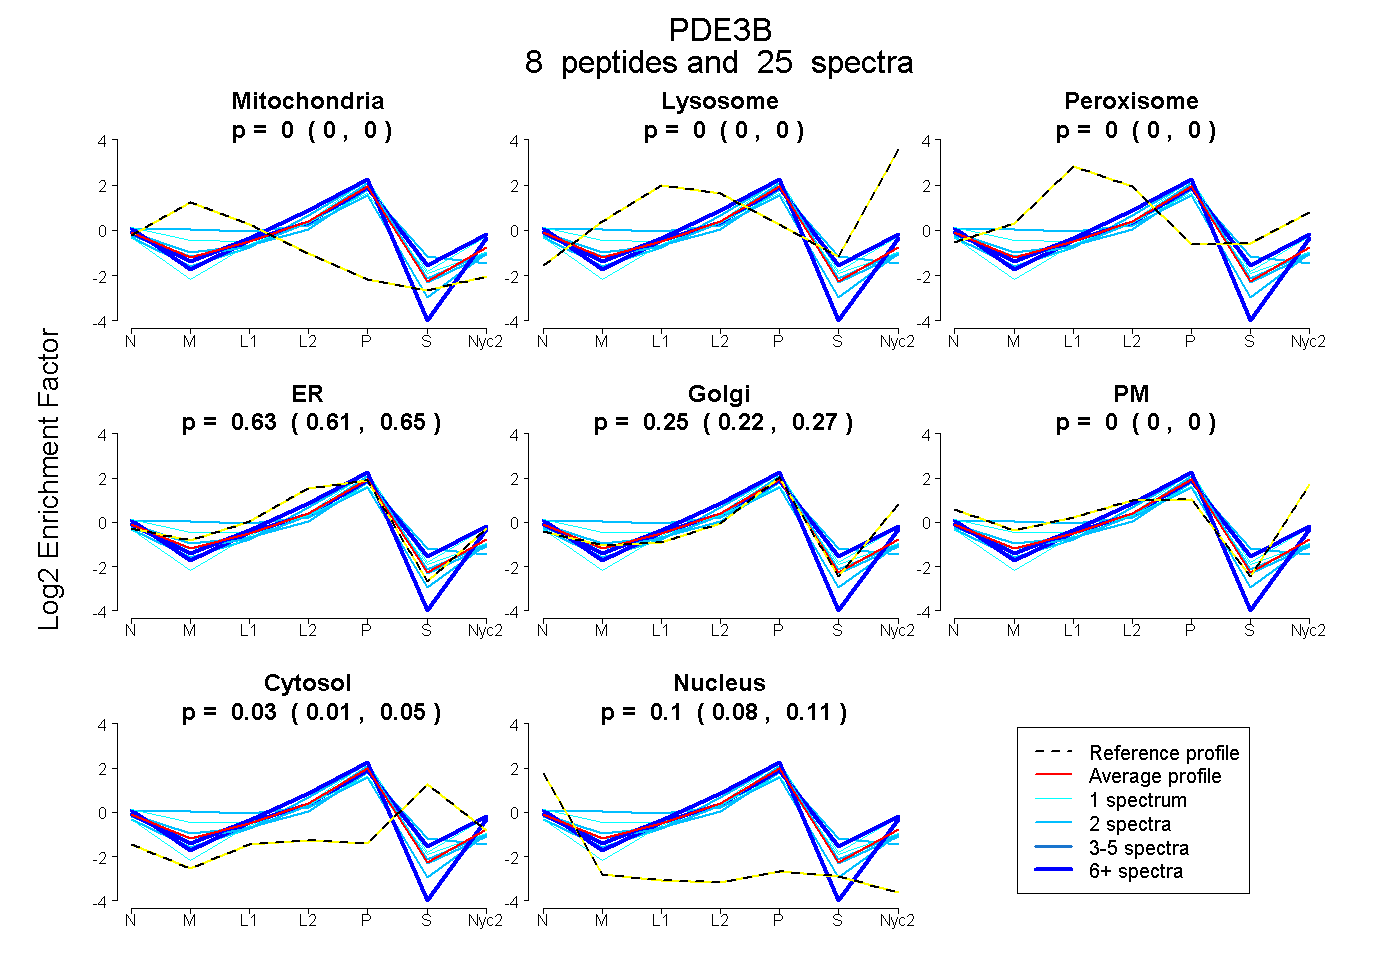
0.000 | 0.000
0.000 | 0.000
0.000 | 0.000
0.605 | 0.647
0.217 | 0.269
0.000 | 0.000
0.005 | 0.051
0.082 | 0.107
3peptides
spectra
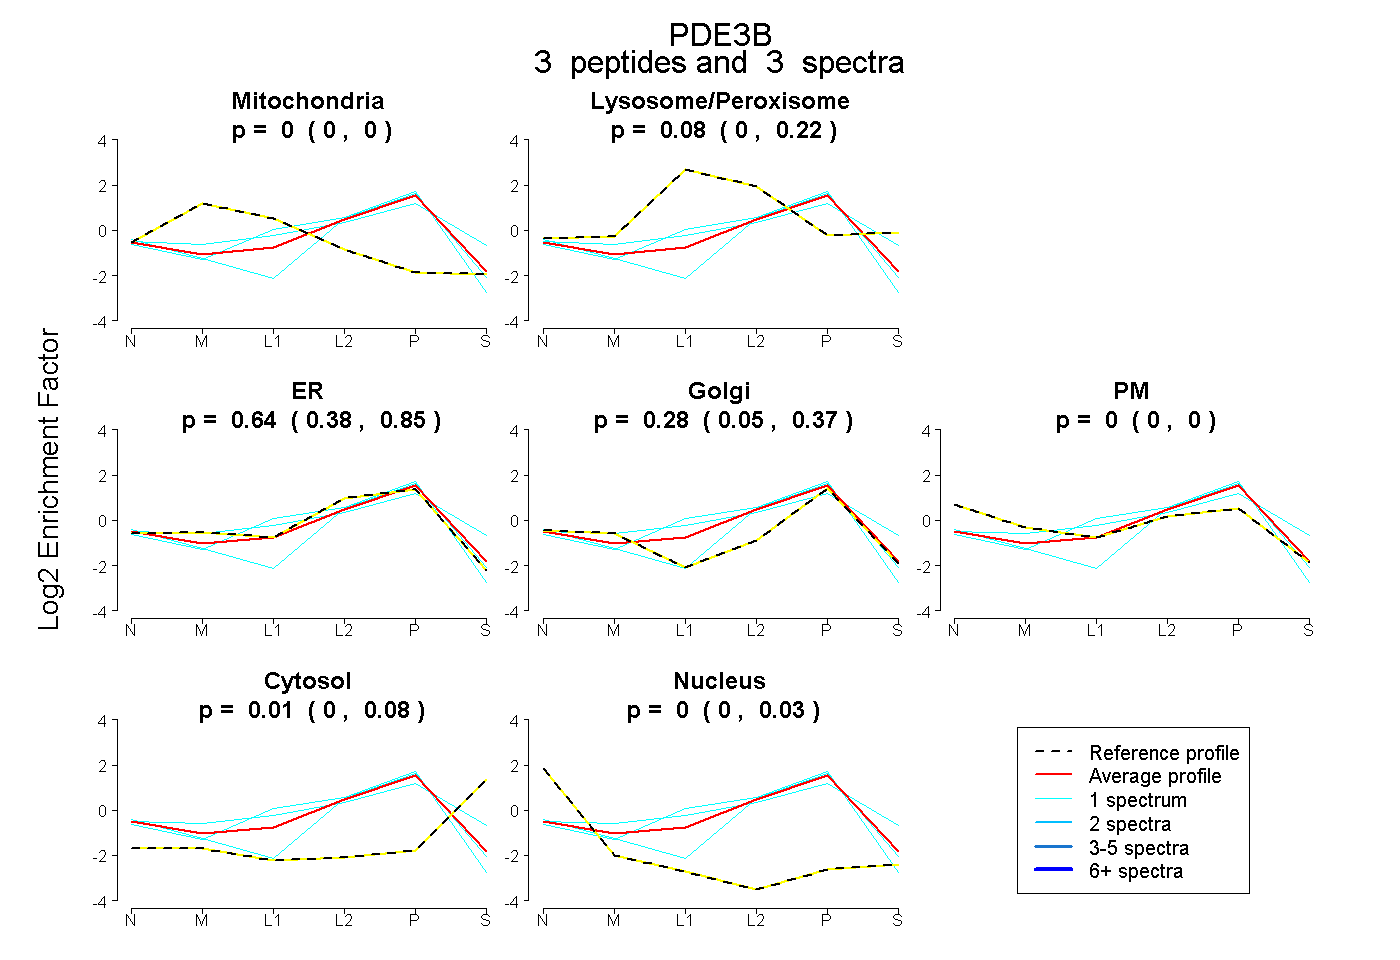
0.000 | 0.000
0.000 | 0.217
0.376 | 0.851
0.052 | 0.372
0.000 | 0.000
0.000 | 0.085
0.000 | 0.032
4peptides
spectra
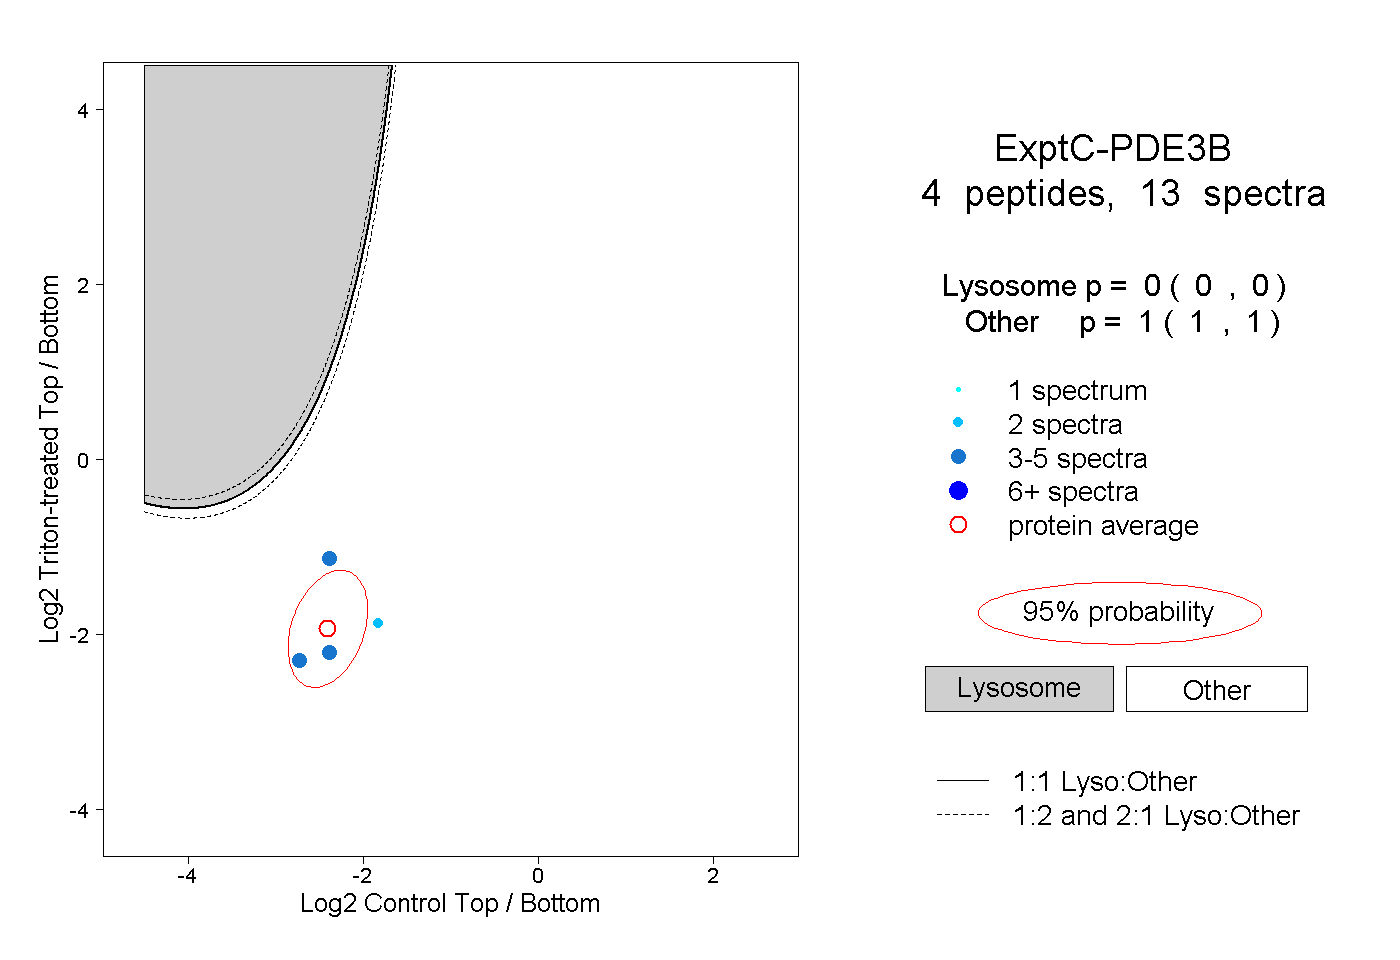
0.000 | 0.000
1.000 | 1.000
1peptide
spectrum
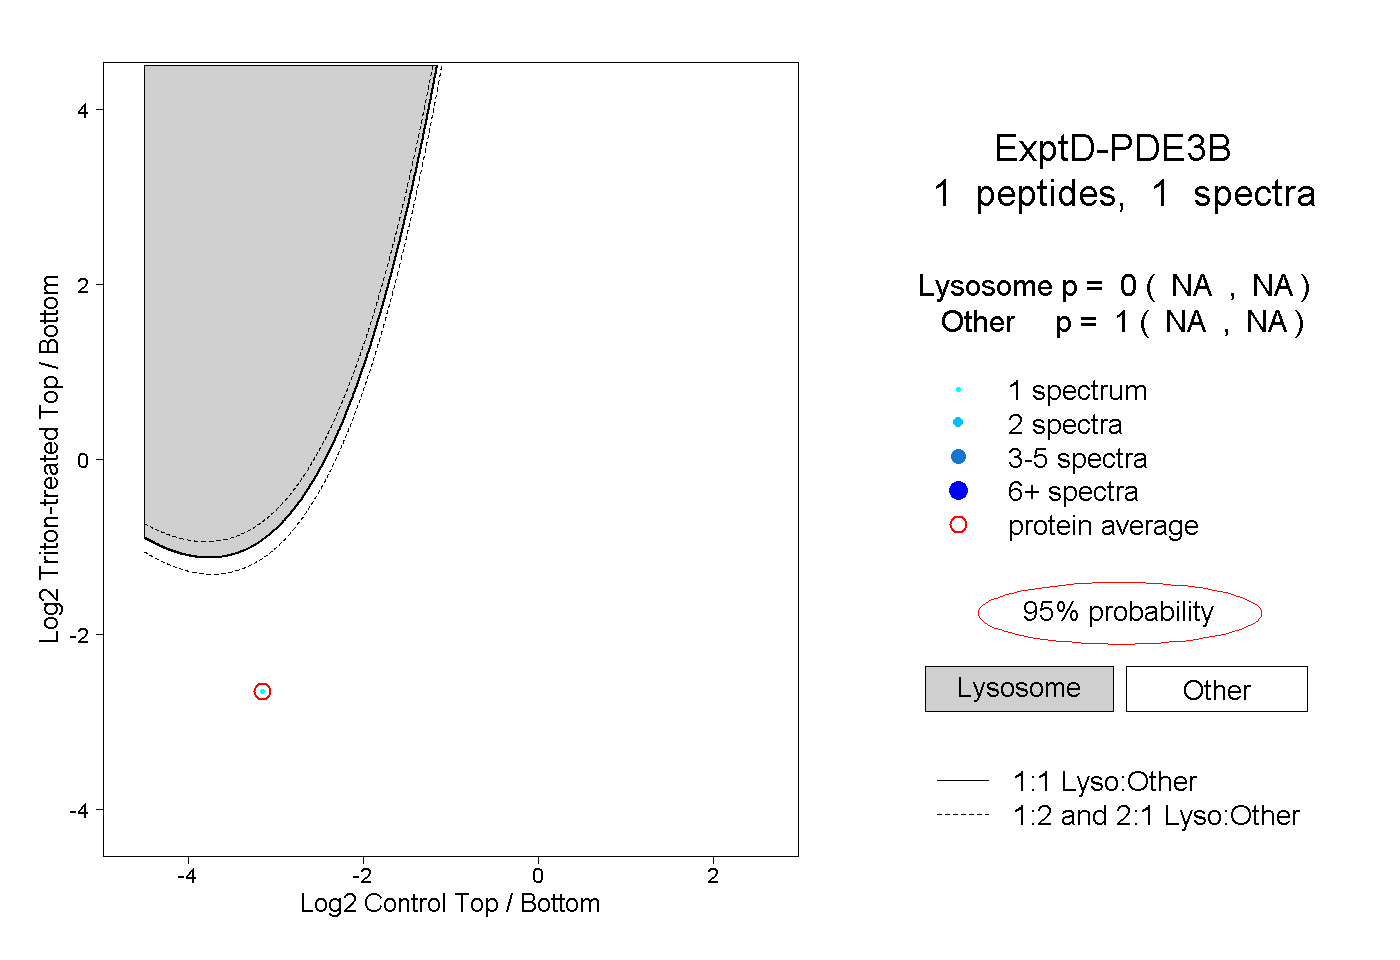
NA | NA
NA | NA