 8
8peptides
spectra
0.000 | 0.000
0.000 | 0.000
0.000 | 0.000
0.605 | 0.647
0.217 | 0.269
0.000 | 0.000
0.005 | 0.051
0.082 | 0.107
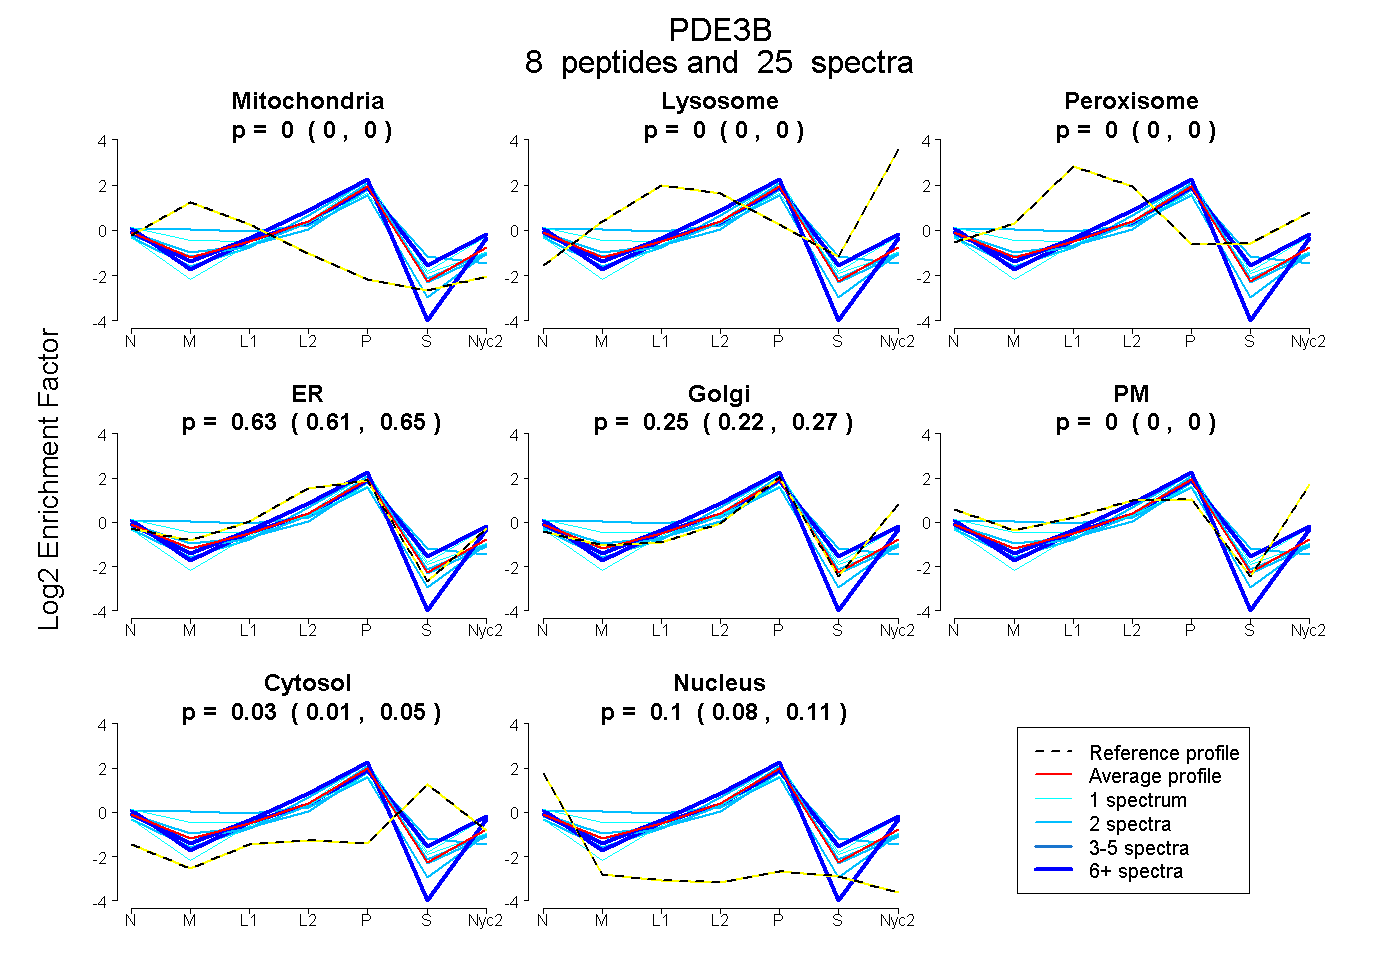
| Plot | Mito | Lyso | Perox | ER | Golgi | PM | Cytosol | Nucleus | |||||
| Expt A |
8 peptides |
25 spectra |
|
0.000 0.000 | 0.000 |
0.000 0.000 | 0.000 |
0.000 0.000 | 0.000 |
0.628 0.605 | 0.647 |
0.246 0.217 | 0.269 |
0.000 0.000 | 0.000 |
0.031 0.005 | 0.051 |
0.096 0.082 | 0.107 |
| 2 spectra, FCNVEPPAASLR | 0.000 | 0.000 | 0.000 | 0.645 | 0.050 | 0.000 | 0.215 | 0.089 | ||
| 2 spectra, SCVSPLR | 0.000 | 0.000 | 0.000 | 0.606 | 0.246 | 0.000 | 0.047 | 0.101 | ||
| 2 spectra, EIIEEEEK | 0.000 | 0.000 | 0.000 | 0.705 | 0.158 | 0.000 | 0.036 | 0.102 | ||
| 1 spectrum, SFFFHLCR | 0.089 | 0.000 | 0.000 | 0.616 | 0.170 | 0.000 | 0.055 | 0.070 | ||
| 2 spectra, GEPAAAAAGR | 0.236 | 0.000 | 0.000 | 0.588 | 0.160 | 0.000 | 0.000 | 0.016 | ||
| 1 spectrum, EQMILWDWDLK | 0.000 | 0.000 | 0.000 | 0.411 | 0.442 | 0.000 | 0.139 | 0.008 | ||
| 7 spectra, RPSLPCISR | 0.000 | 0.000 | 0.000 | 0.452 | 0.371 | 0.000 | 0.162 | 0.015 | ||
| 8 spectra, VPVIRPR | 0.000 | 0.000 | 0.000 | 0.751 | 0.196 | 0.000 | 0.000 | 0.053 |
| Plot | Mito | Lyso or Perox | ER | Golgi | PM | Cytosol | Nucleus | ||||||
| Expt B |
3 peptides |
3 spectra |
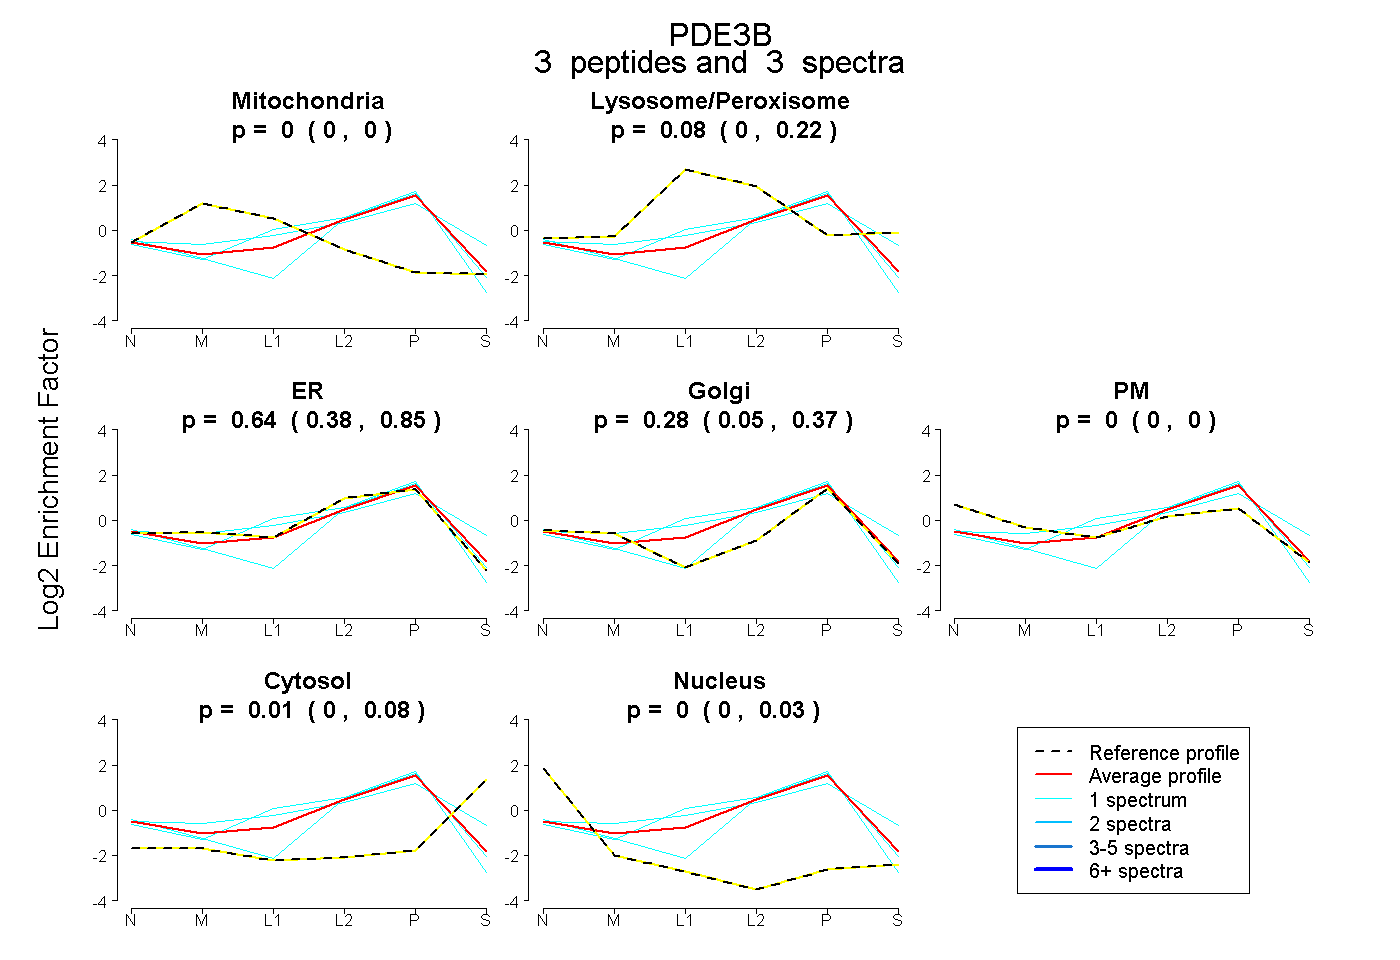 |
0.000 0.000 | 0.000 |
0.077 0.000 | 0.217 |
0.638 0.376 | 0.851 |
0.280 0.052 | 0.372 |
0.000 0.000 | 0.000 |
0.005 0.000 | 0.085 |
0.000 0.000 | 0.032 |
|||
| Plot | Lyso | Other | |||||||||||
| Expt C |
4 peptides |
13 spectra |
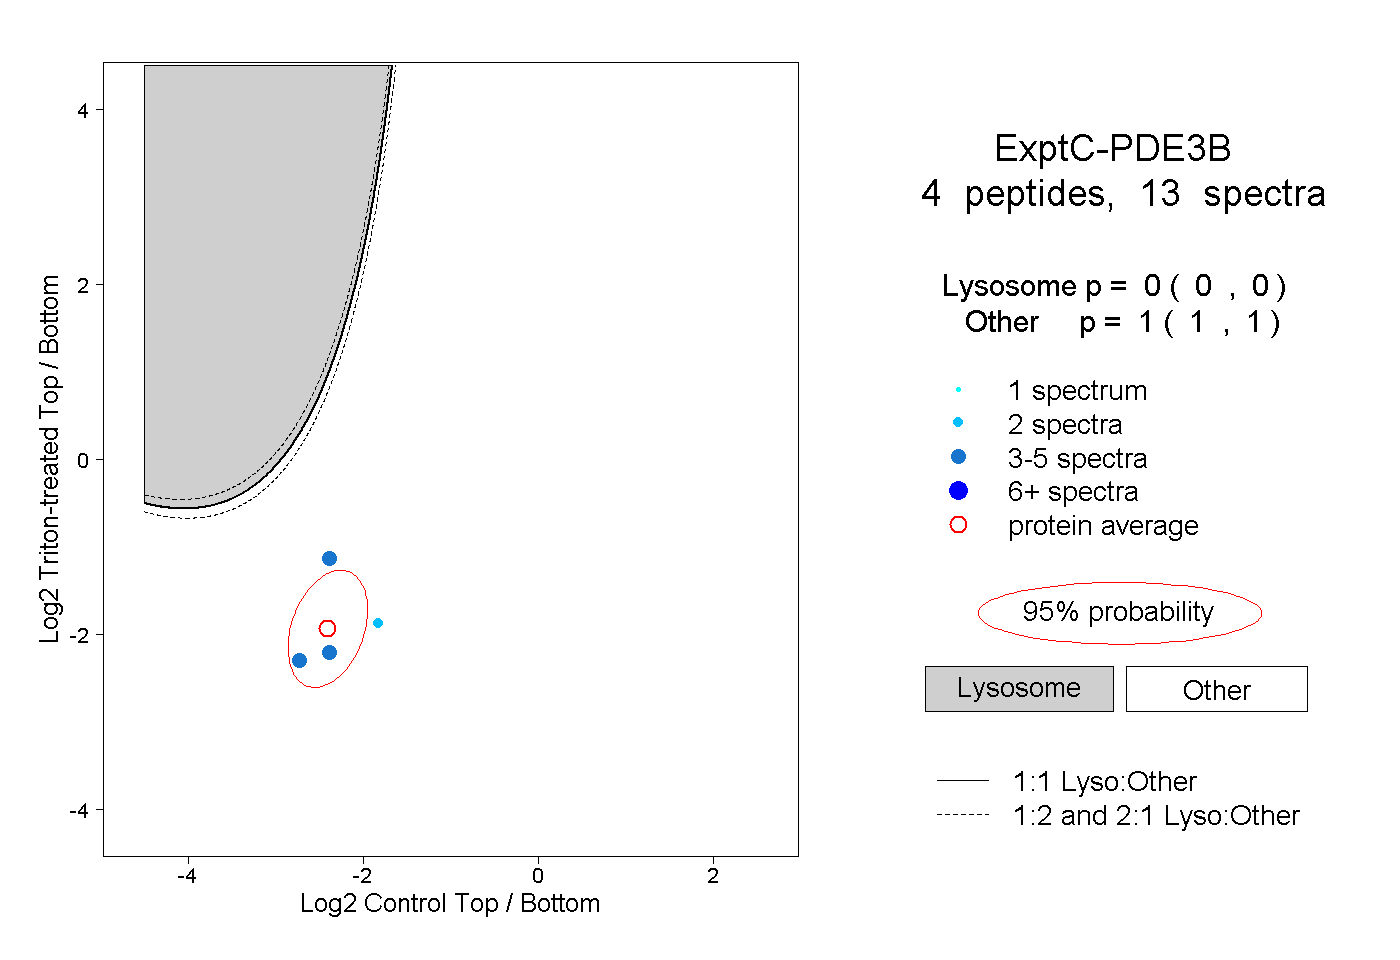 |
0.000 0.000 | 0.000 |
1.000 1.000 | 1.000 |
||||||||
| Plot | Lyso | Other | |||||||||||
| Expt D |
1 peptide |
1 spectrum |
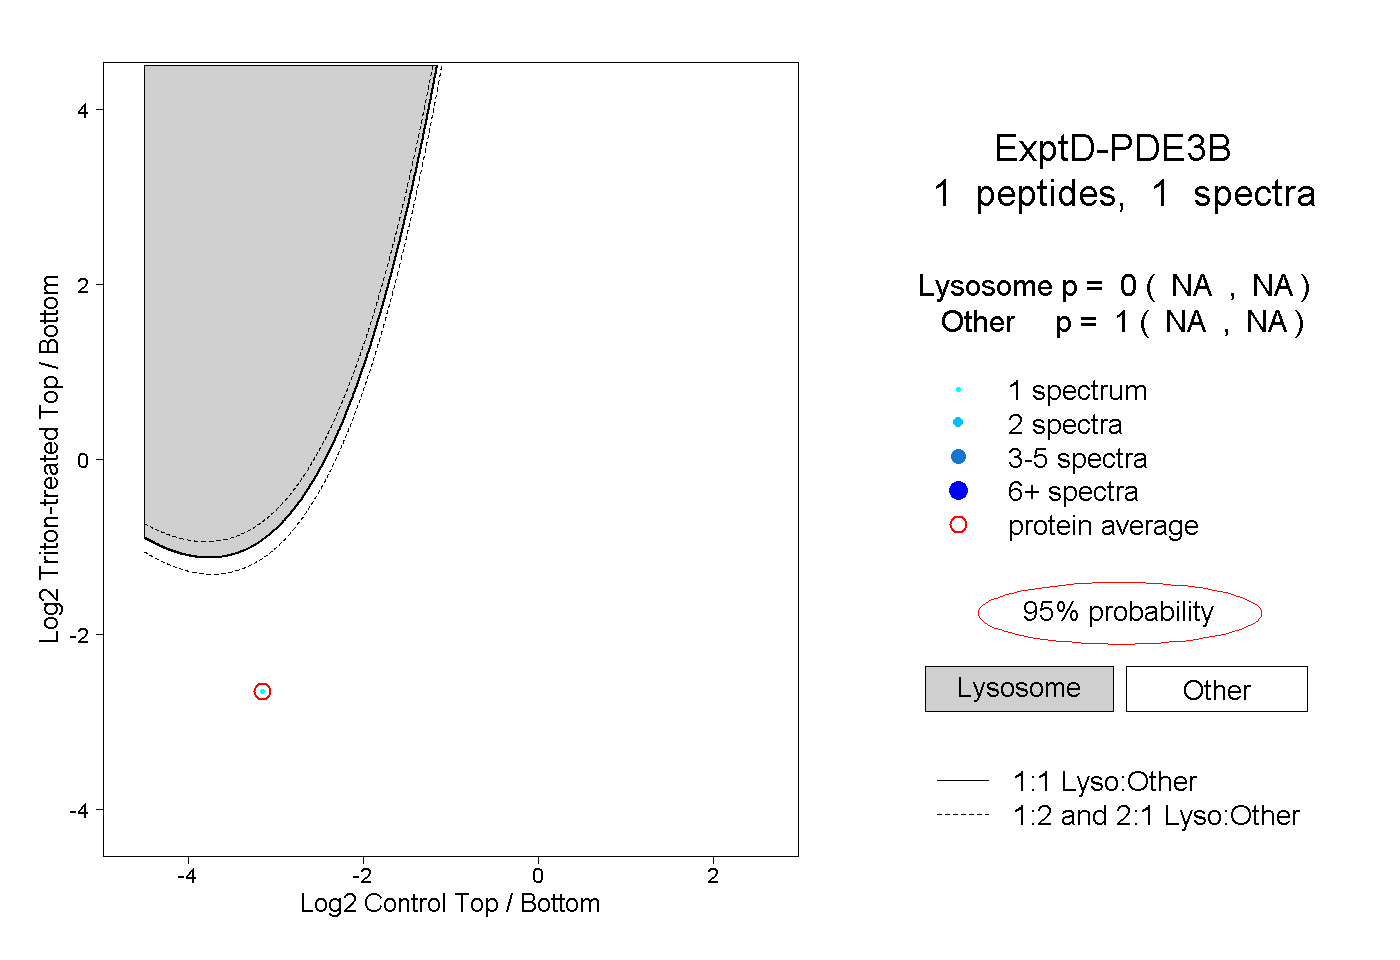 |
0.000 NA | NA |
1.000 NA | NA |