 8
8peptides
spectra
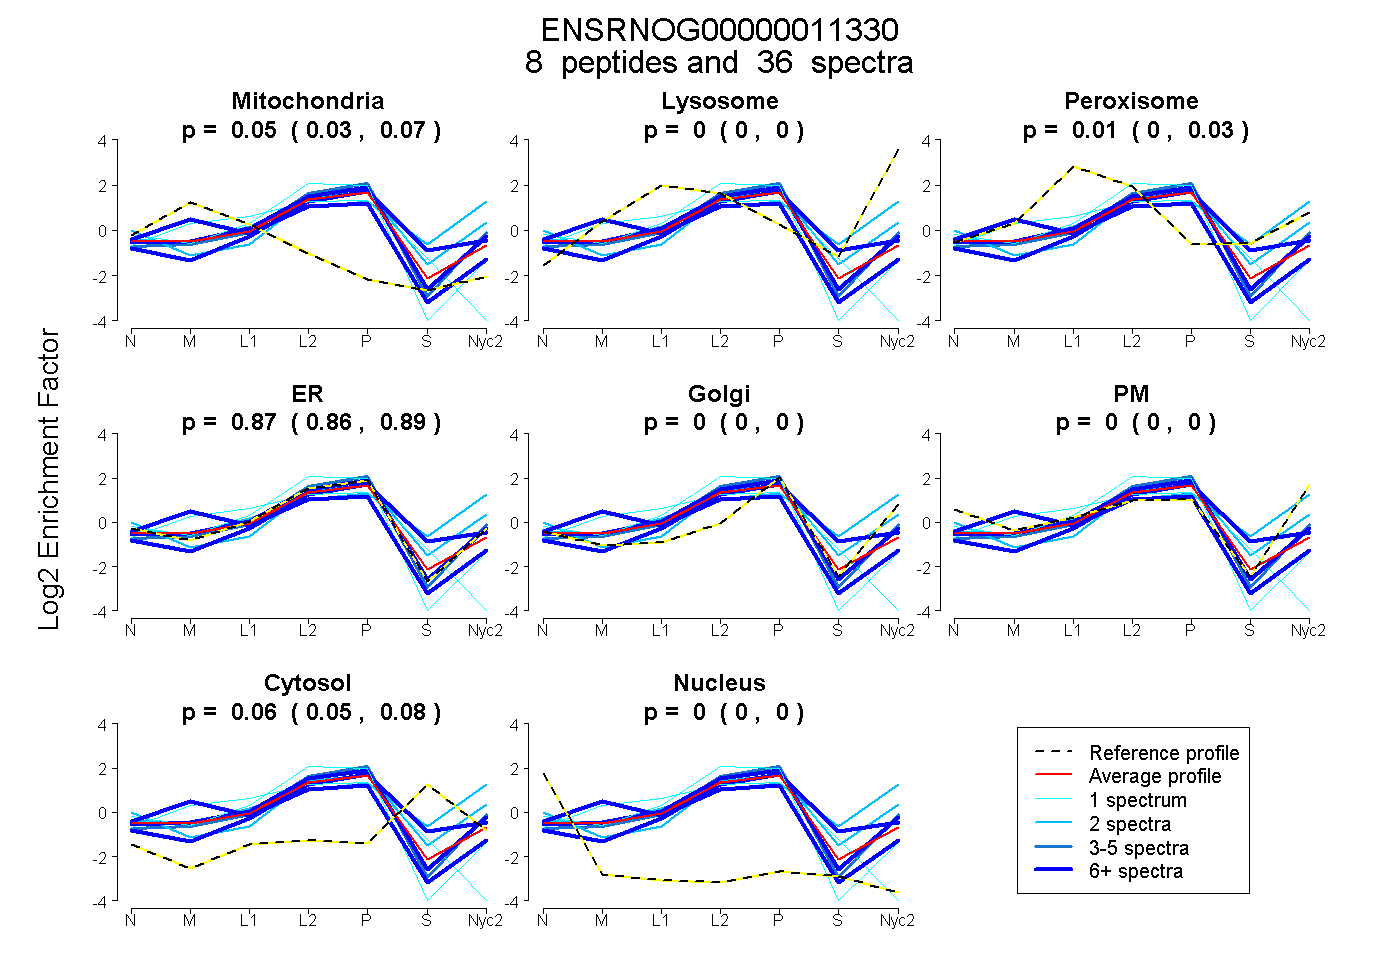
0.030 | 0.071
0.000 | 0.000
0.000 | 0.029
0.856 | 0.886
0.000 | 0.000
0.000 | 0.000
0.045 | 0.080
0.000 | 0.000
4peptides
spectra
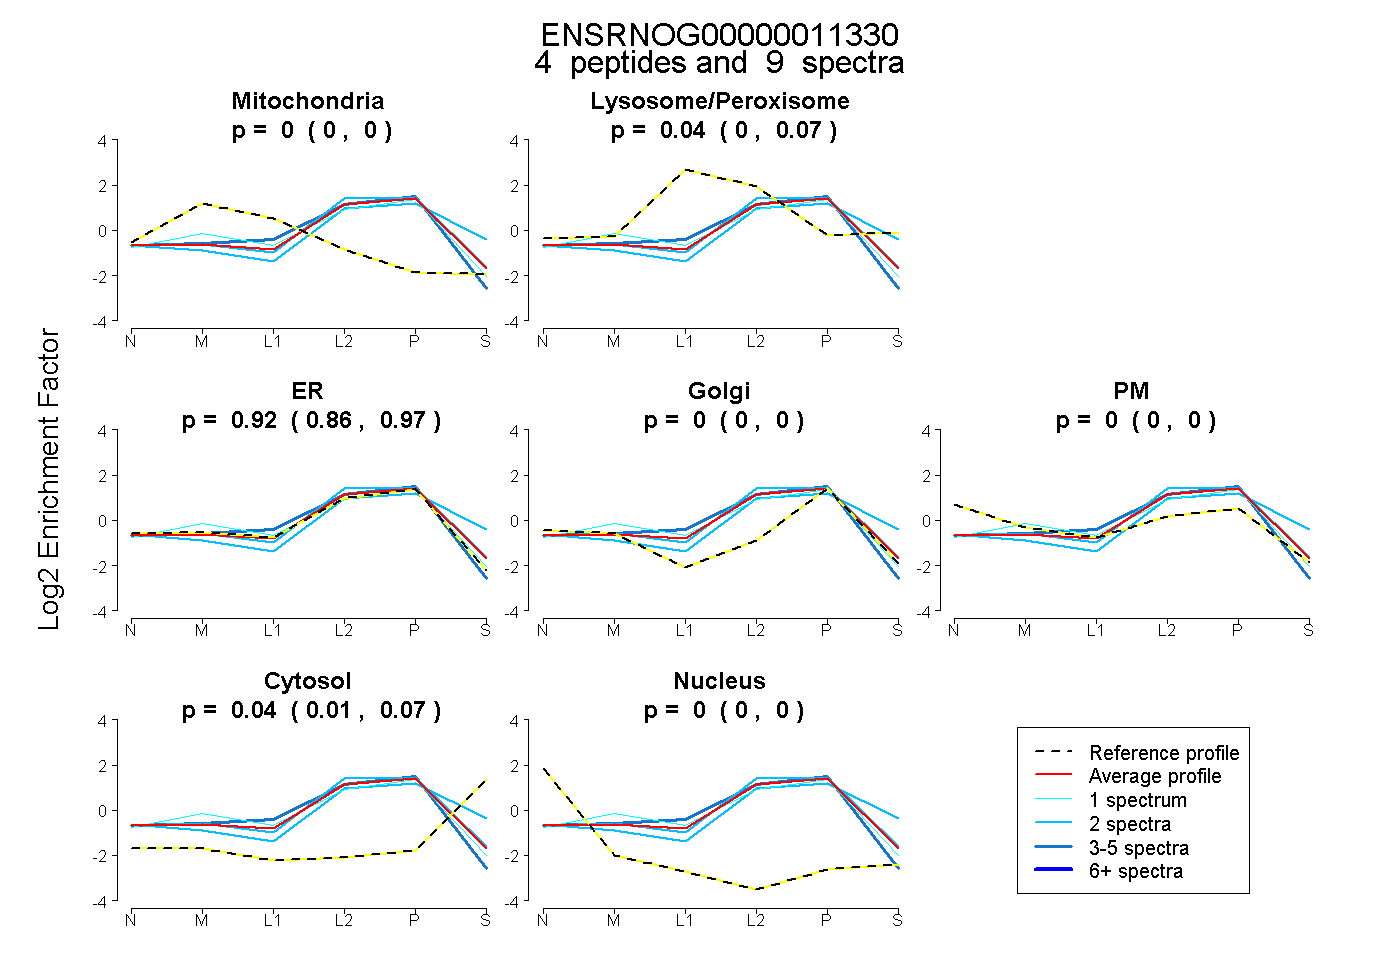
0.000 | 0.000
0.000 | 0.074
0.859 | 0.973
0.000 | 0.000
0.000 | 0.000
0.008 | 0.065
0.000 | 0.000
8peptides
spectra
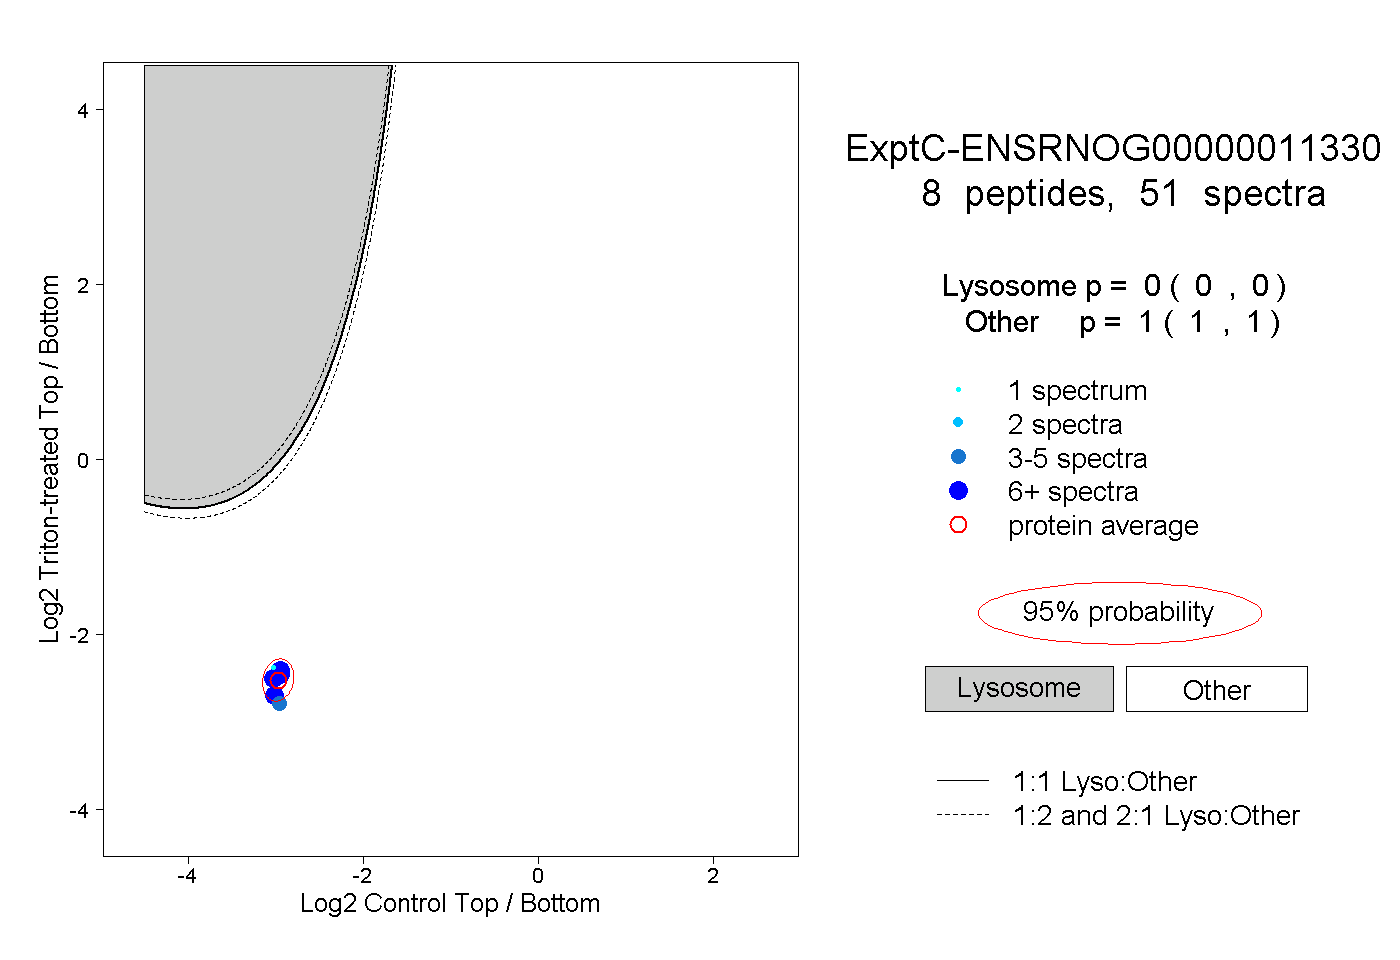
0.000 | 0.000
1.000 | 1.000
7peptides
spectra
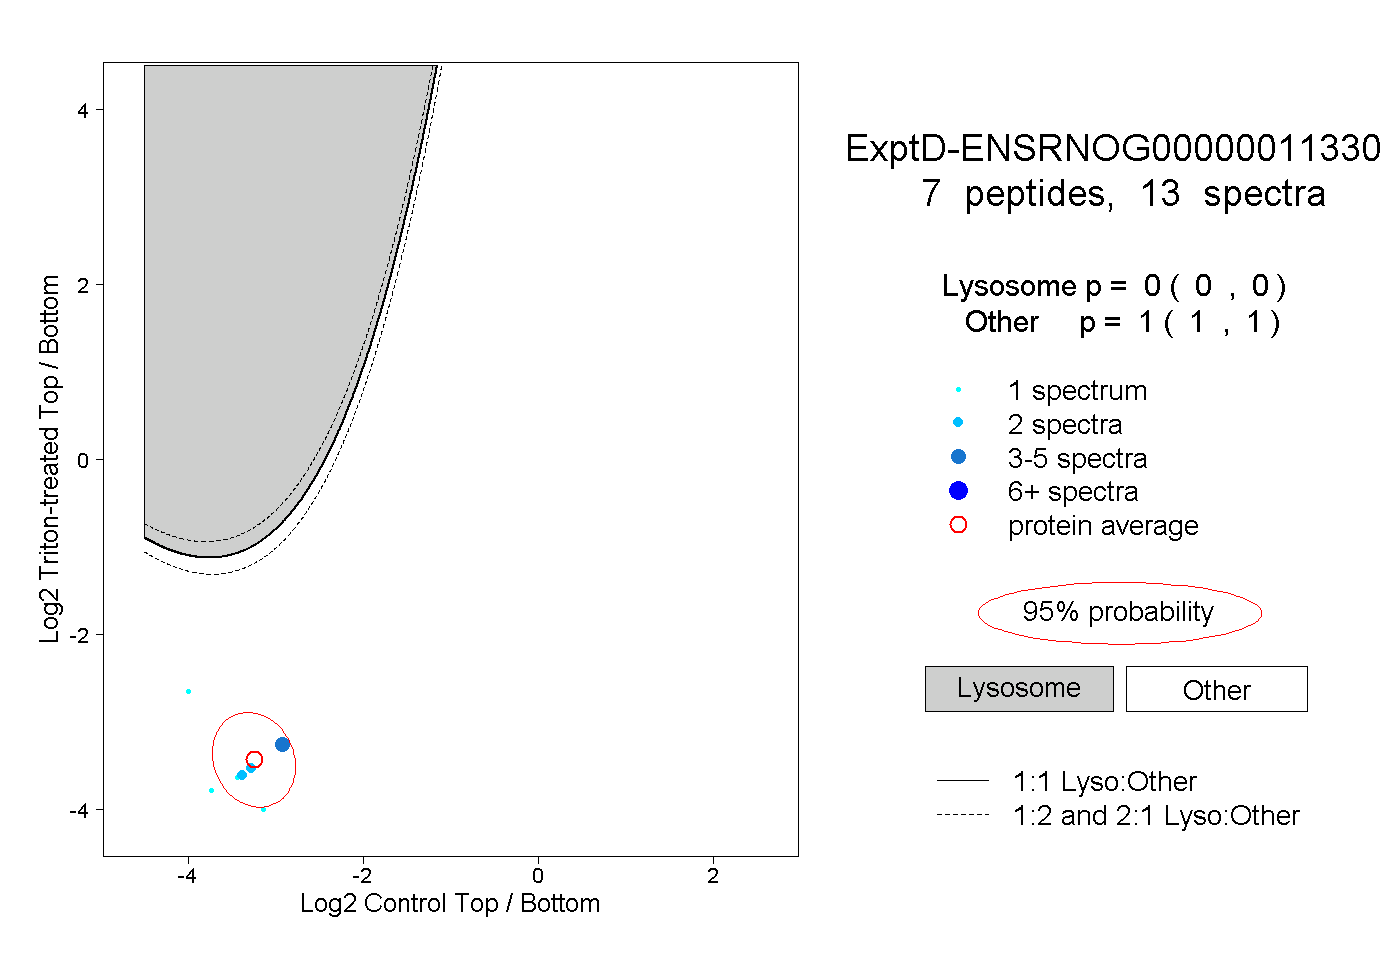
0.000 | 0.000
1.000 | 1.000