 8
8peptides
spectra
0.030 | 0.071
0.000 | 0.000
0.000 | 0.029
0.856 | 0.886
0.000 | 0.000
0.000 | 0.000
0.045 | 0.080
0.000 | 0.000
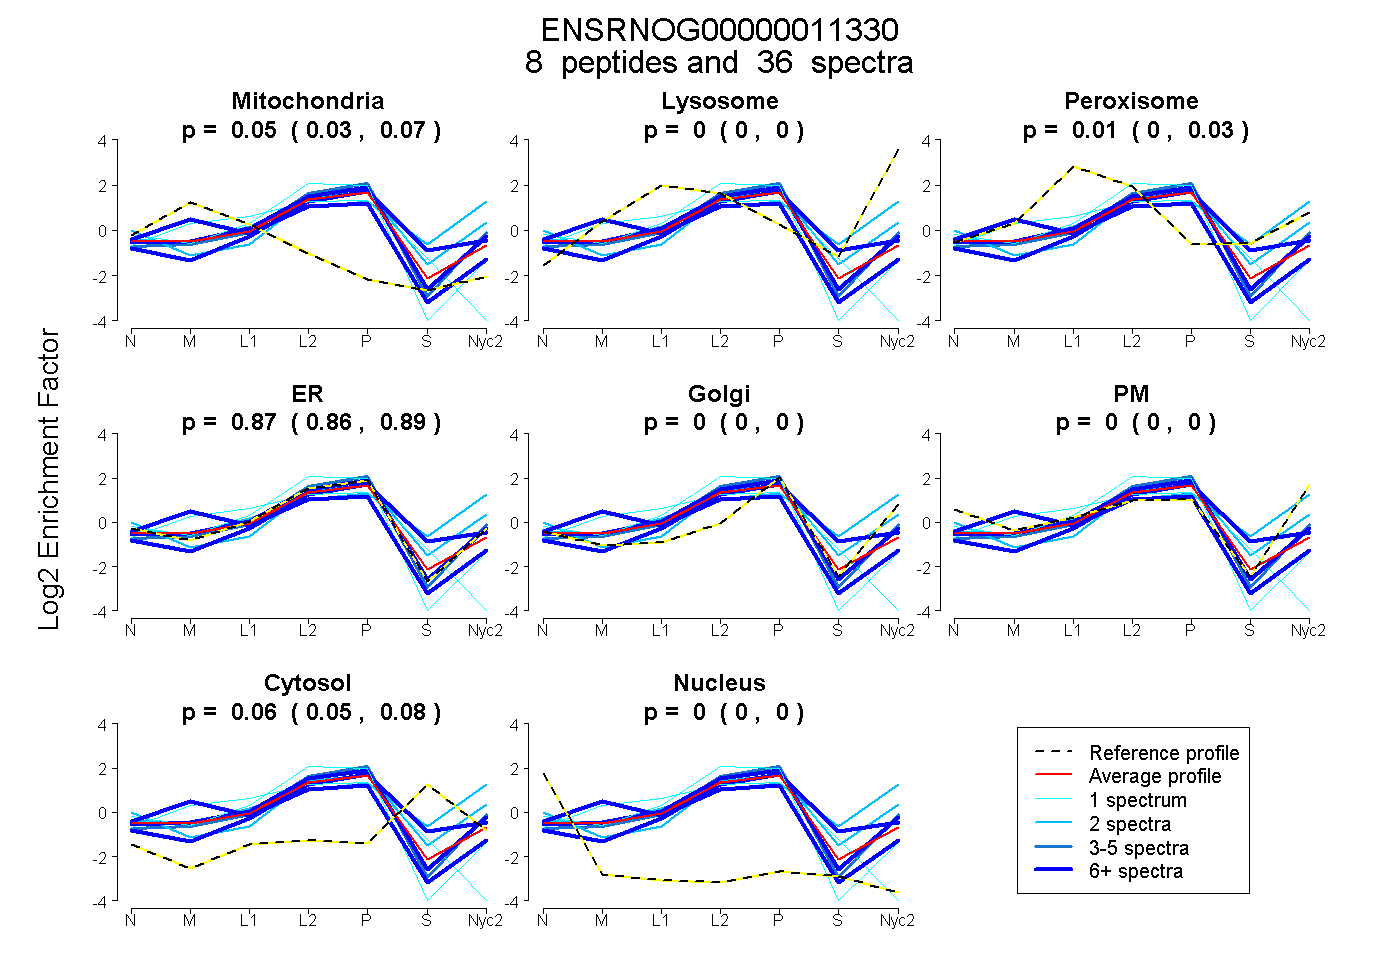
| Plot | Mito | Lyso | Perox | ER | Golgi | PM | Cytosol | Nucleus | |||||
| Expt A |
8 peptides |
36 spectra |
|
0.052 0.030 | 0.071 |
0.000 0.000 | 0.000 |
0.010 0.000 | 0.029 |
0.874 0.856 | 0.886 |
0.000 0.000 | 0.000 |
0.000 0.000 | 0.000 |
0.064 0.045 | 0.080 |
0.000 0.000 | 0.000 |
| 2 spectra, LGVLGFFSTGDQNAR | 0.000 | 0.000 | 0.000 | 0.563 | 0.107 | 0.199 | 0.131 | 0.000 | ||
| 1 spectrum, TVANLSGCEAPDSEALIR | 0.023 | 0.000 | 0.000 | 0.977 | 0.000 | 0.000 | 0.000 | 0.000 | ||
| 10 spectra, SEVVYK | 0.022 | 0.031 | 0.000 | 0.947 | 0.000 | 0.000 | 0.000 | 0.000 | ||
| 3 spectra, ETLPTVLK | 0.000 | 0.014 | 0.000 | 0.956 | 0.030 | 0.000 | 0.000 | 0.000 | ||
| 7 spectra, WVQQNIAYFGGNHGK | 0.281 | 0.000 | 0.000 | 0.719 | 0.000 | 0.000 | 0.000 | 0.000 | ||
| 10 spectra, MIPGVVDGK | 0.000 | 0.011 | 0.000 | 0.734 | 0.000 | 0.000 | 0.255 | 0.000 | ||
| 2 spectra, DATSQPAMCLQTDIMNLDGIK | 0.000 | 0.271 | 0.055 | 0.199 | 0.185 | 0.128 | 0.162 | 0.000 | ||
| 1 spectrum, QEILAINQVFK | 0.371 | 0.000 | 0.000 | 0.597 | 0.000 | 0.000 | 0.032 | 0.000 |
| Plot | Mito | Lyso or Perox | ER | Golgi | PM | Cytosol | Nucleus | ||||||
| Expt B |
4 peptides |
9 spectra |
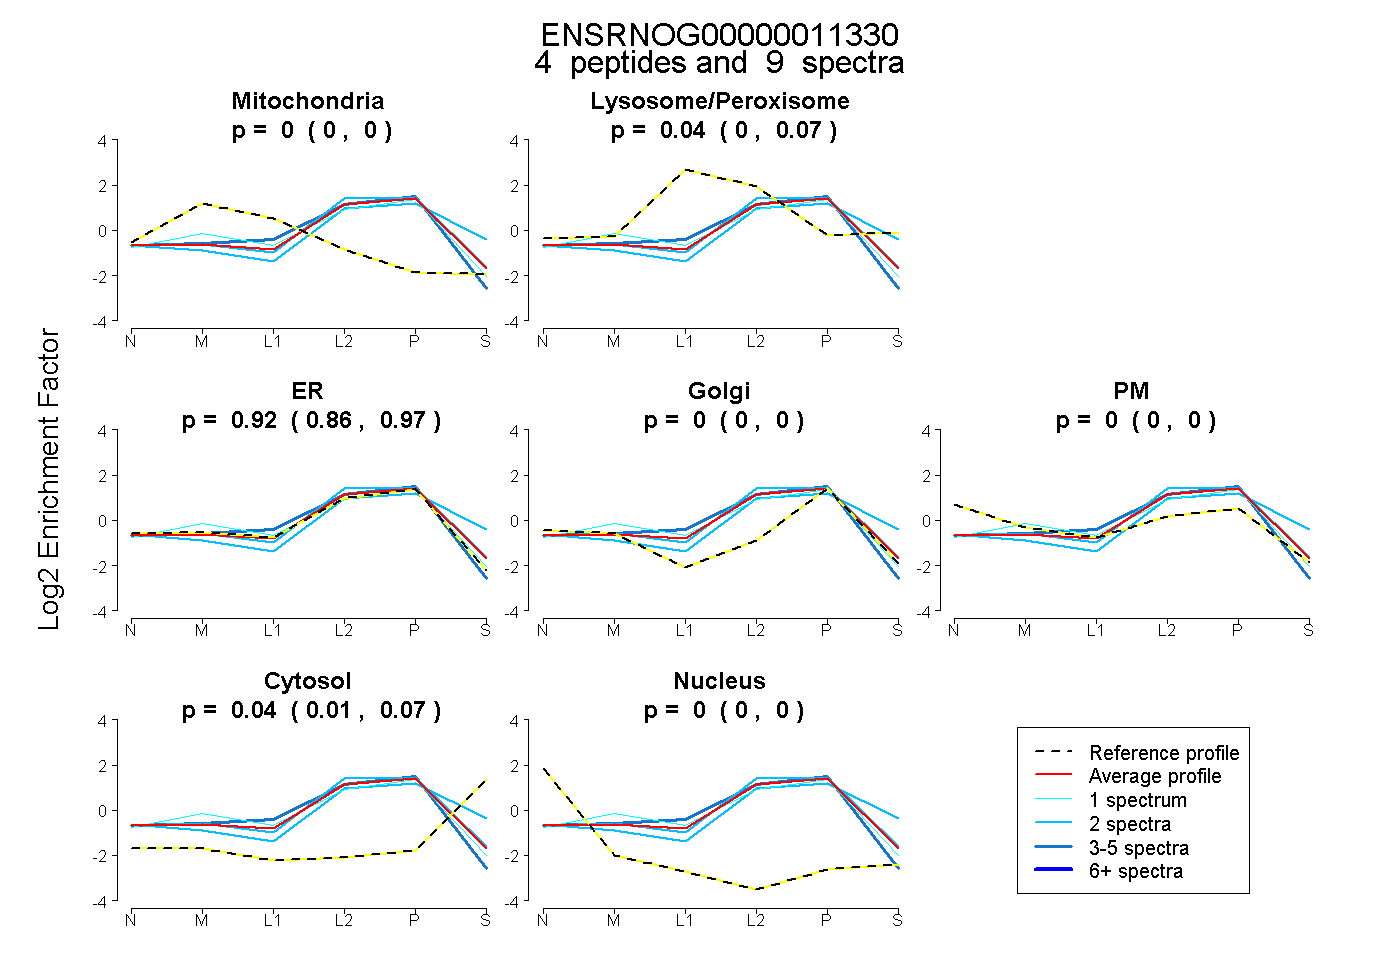 |
0.000 0.000 | 0.000 |
0.039 0.000 | 0.074 |
0.922 0.859 | 0.973 |
0.000 0.000 | 0.000 |
0.000 0.000 | 0.000 |
0.038 0.008 | 0.065 |
0.000 0.000 | 0.000 |
|||
| Plot | Lyso | Other | |||||||||||
| Expt C |
8 peptides |
51 spectra |
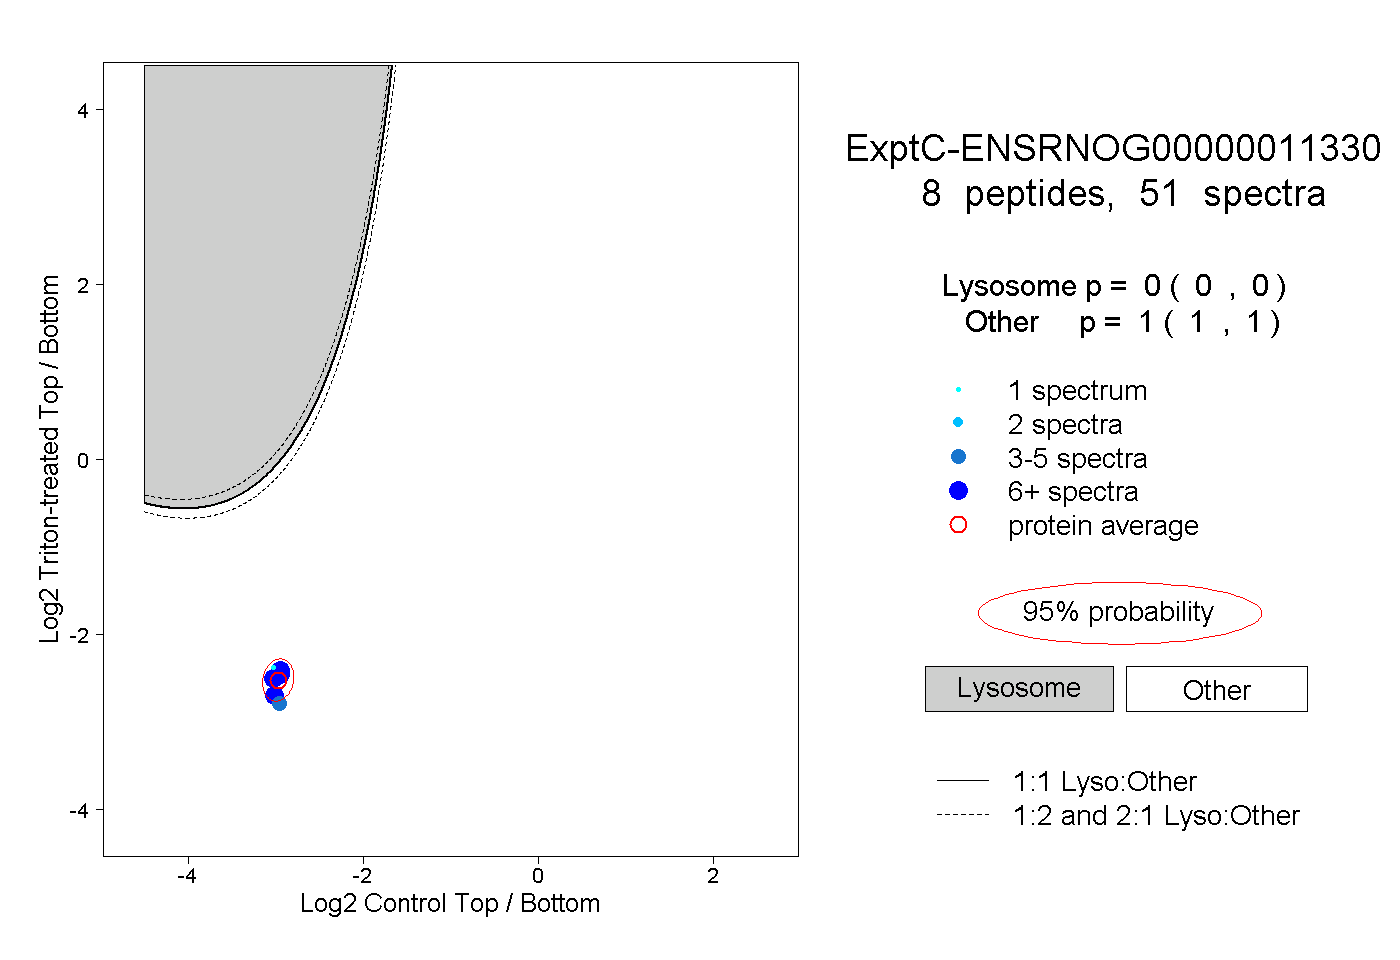 |
0.000 0.000 | 0.000 |
1.000 1.000 | 1.000 |
||||||||
| Plot | Lyso | Other | |||||||||||
| Expt D |
7 peptides |
13 spectra |
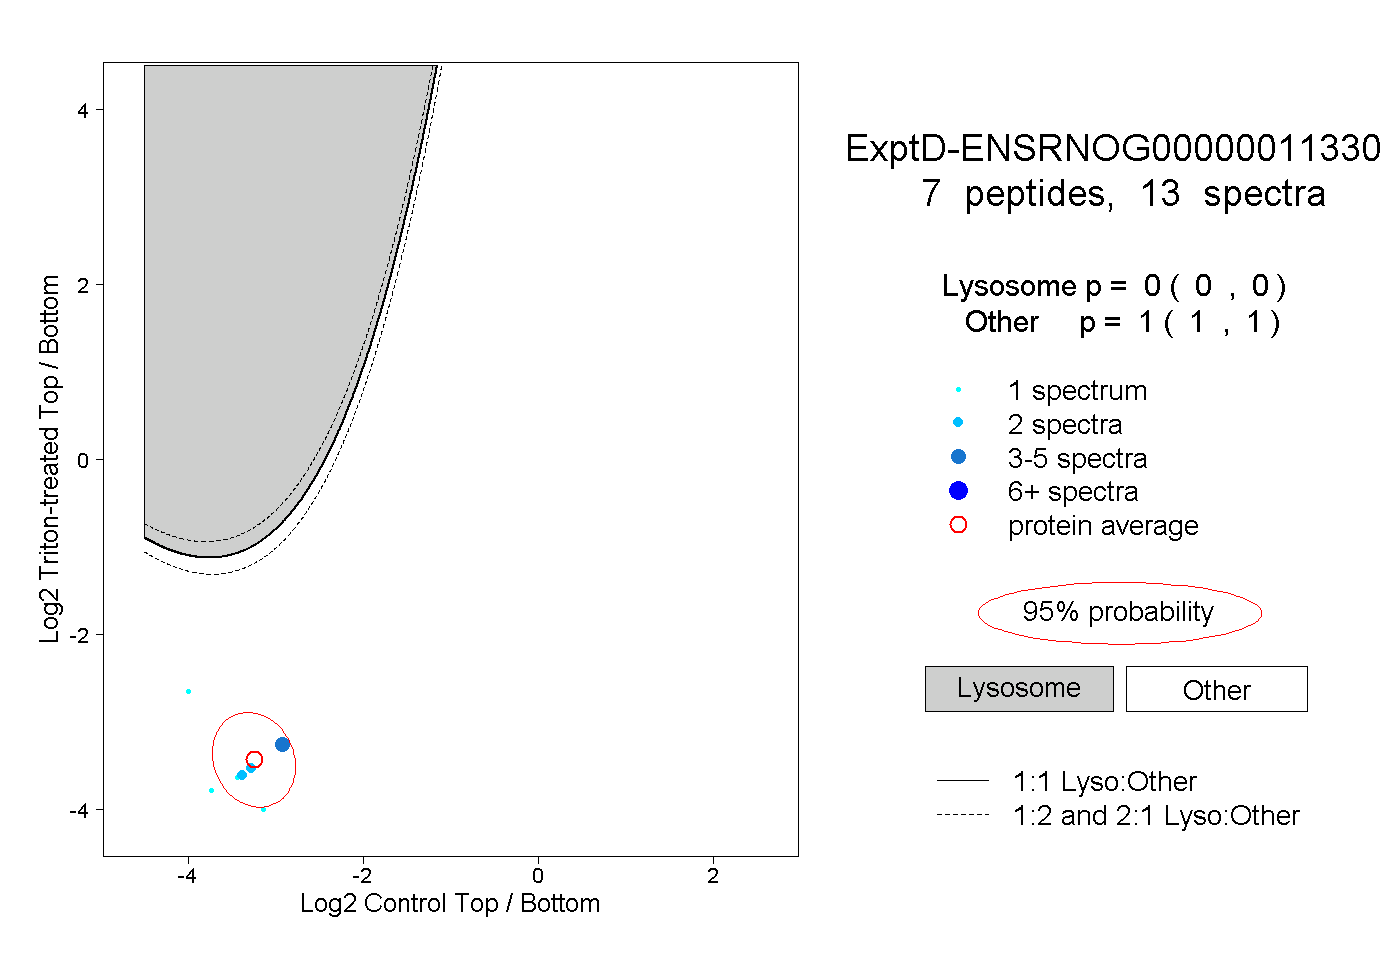 |
0.000 0.000 | 0.000 |
1.000 1.000 | 1.000 |