 11
11peptides
spectra
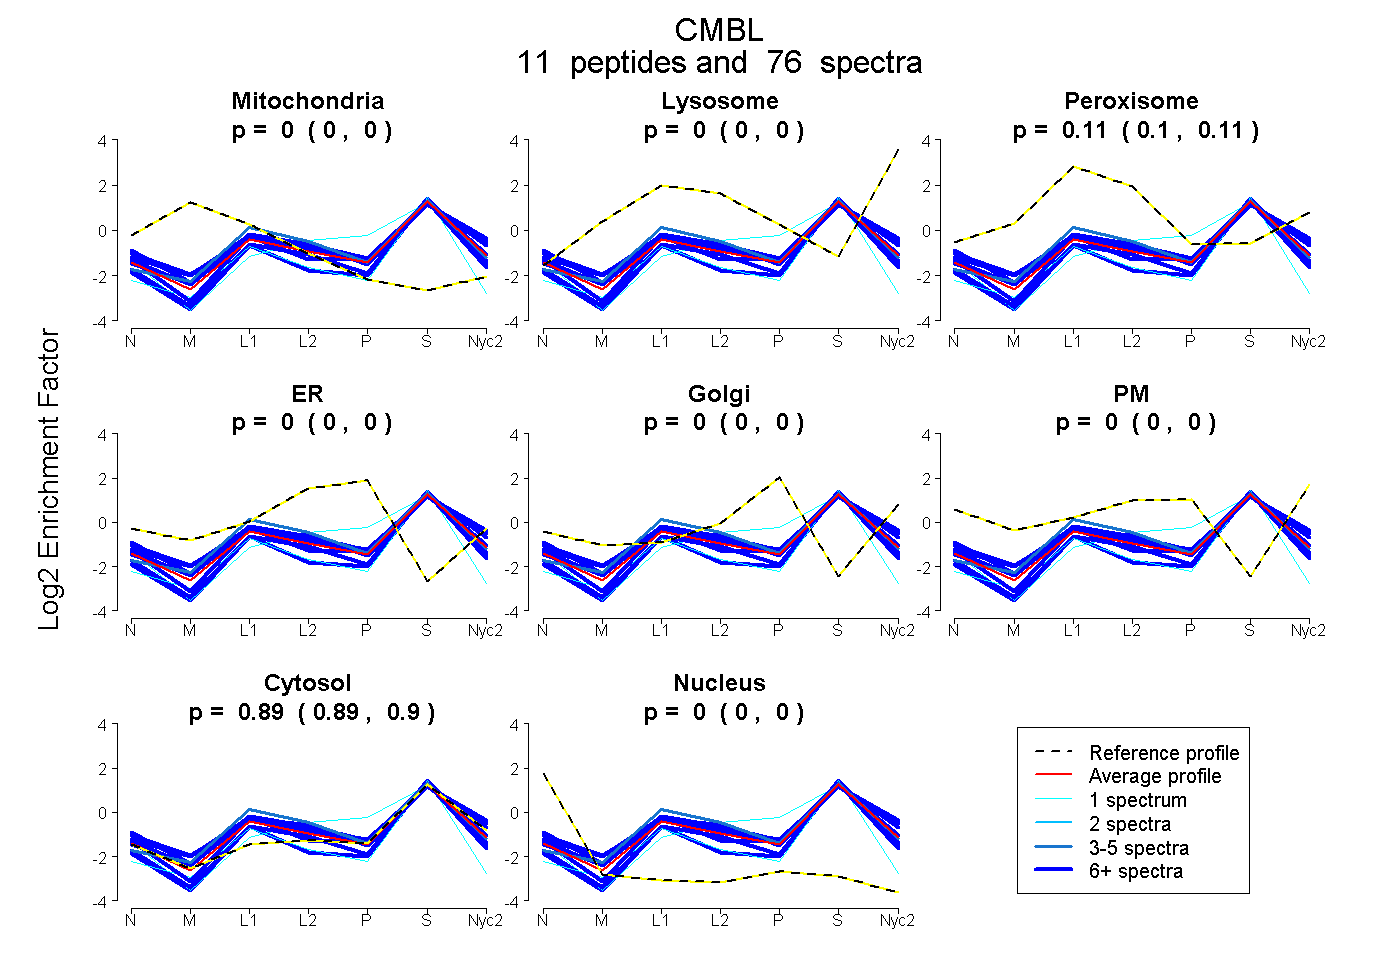
0.000 | 0.000
0.000 | 0.000
0.103 | 0.111
0.000 | 0.000
0.000 | 0.000
0.000 | 0.000
0.888 | 0.896
0.000 | 0.000
6peptides
spectra
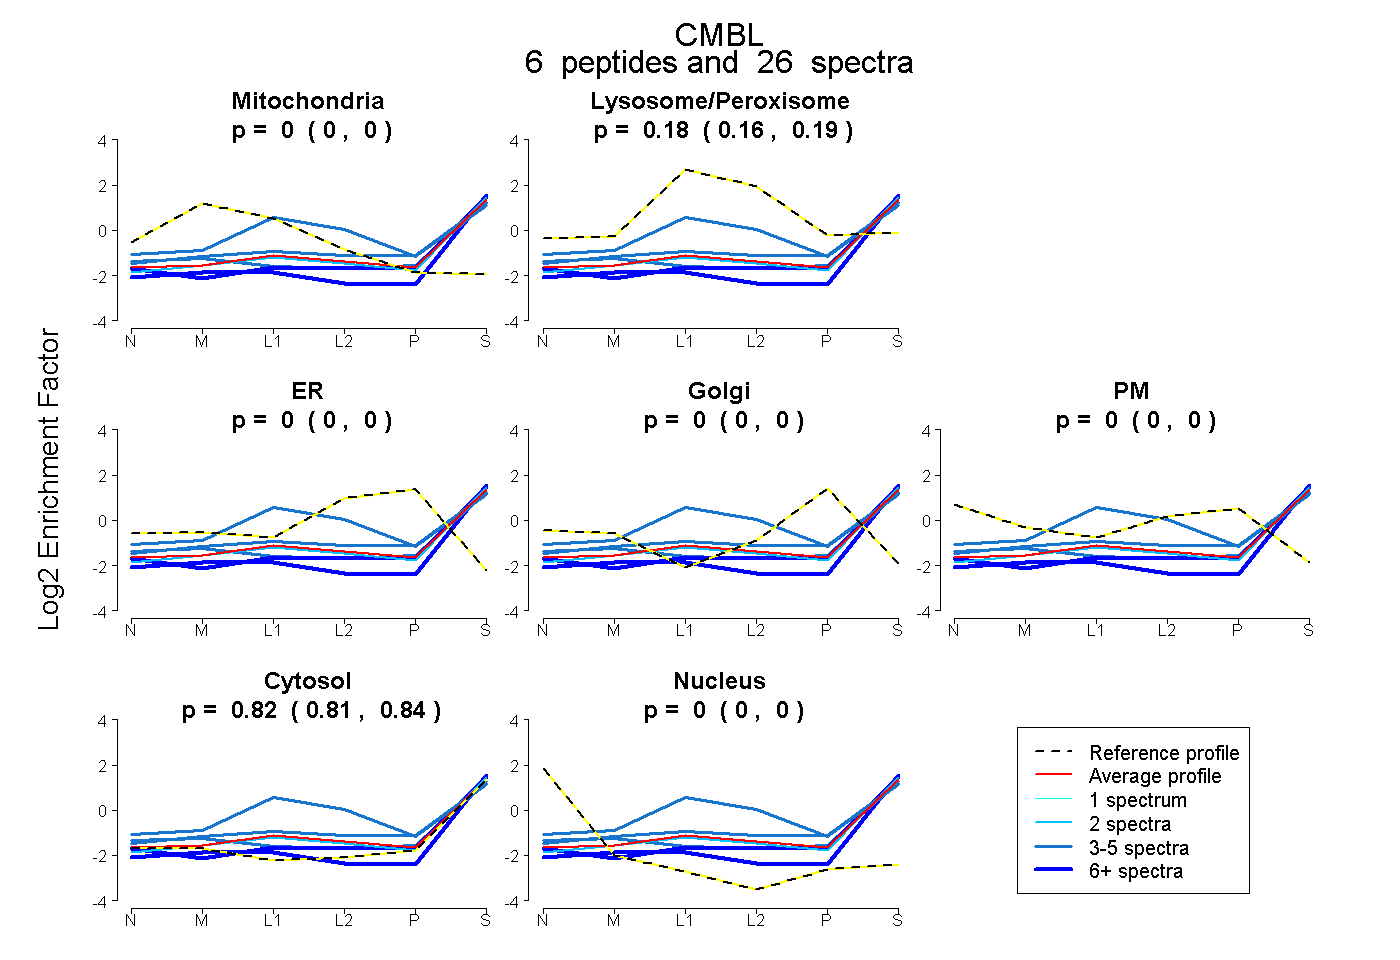
0.000 | 0.000
0.160 | 0.192
0.000 | 0.000
0.000 | 0.000
0.000 | 0.000
0.805 | 0.838
0.000 | 0.000
10peptides
spectra
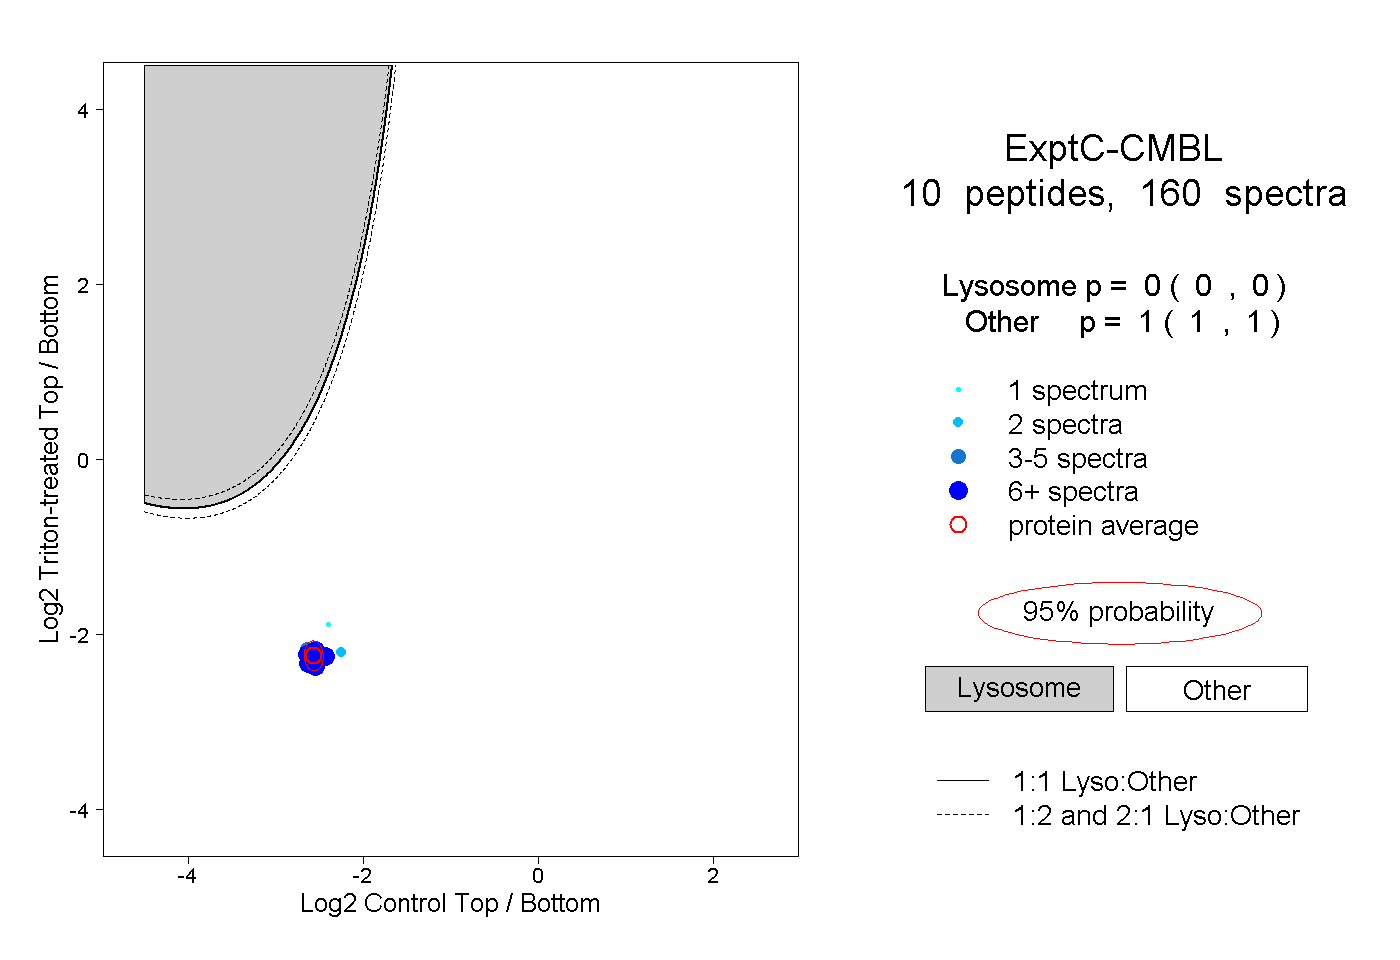
0.000 | 0.000
1.000 | 1.000
4peptides
spectra
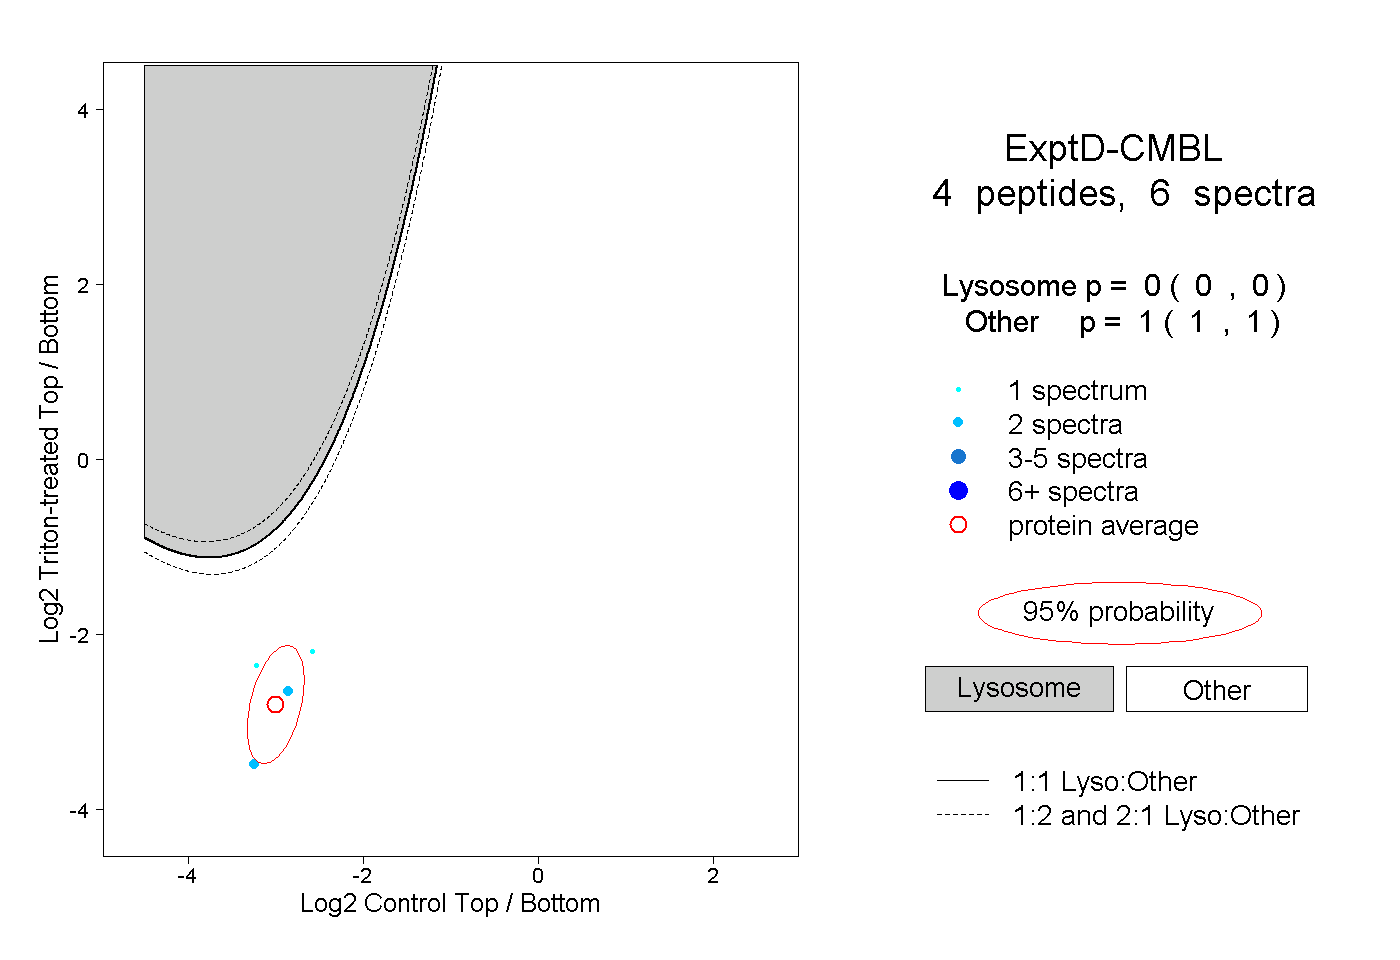
0.000 | 0.000
1.000 | 1.000