 11
11peptides
spectra
0.000 | 0.000
0.000 | 0.000
0.103 | 0.111
0.000 | 0.000
0.000 | 0.000
0.000 | 0.000
0.888 | 0.896
0.000 | 0.000
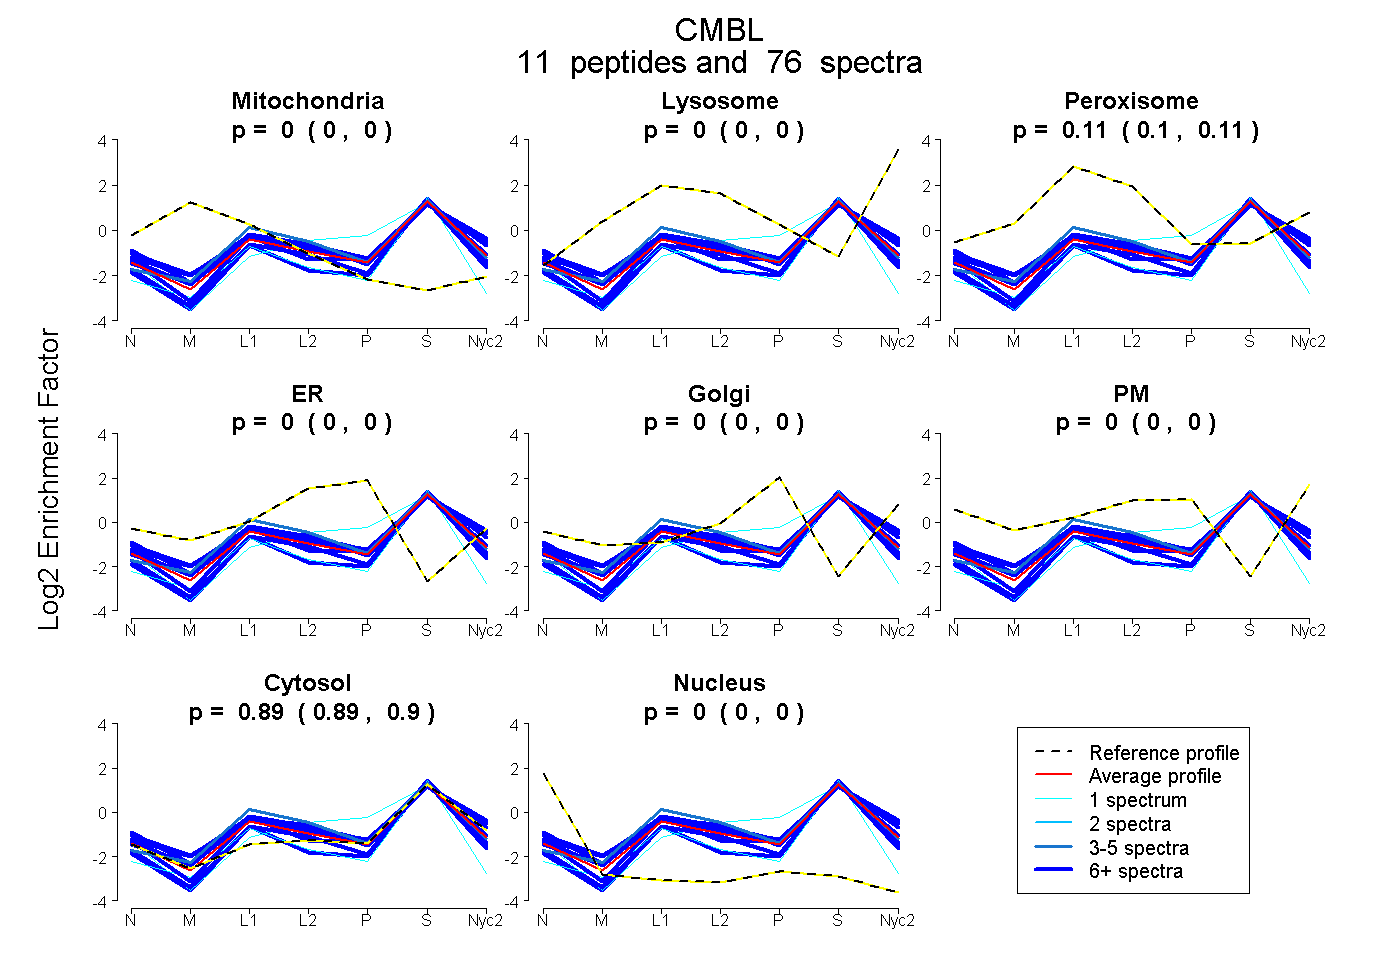
| Plot | Mito | Lyso | Perox | ER | Golgi | PM | Cytosol | Nucleus | |||||
| Expt A |
11 peptides |
76 spectra |
|
0.000 0.000 | 0.000 |
0.000 0.000 | 0.000 |
0.107 0.103 | 0.111 |
0.000 0.000 | 0.000 |
0.000 0.000 | 0.000 |
0.000 0.000 | 0.000 |
0.893 0.888 | 0.896 |
0.000 0.000 | 0.000 |
| 7 spectra, QQCHAQK | 0.000 | 0.000 | 0.087 | 0.000 | 0.000 | 0.000 | 0.900 | 0.013 | ||
| 1 spectrum, EHCIVNYQVK | 0.000 | 0.000 | 0.000 | 0.000 | 0.000 | 0.000 | 0.934 | 0.066 | ||
| 12 spectra, DSEDVYNLK | 0.000 | 0.000 | 0.183 | 0.000 | 0.000 | 0.000 | 0.817 | 0.000 | ||
| 6 spectra, AGVSVYGIIR | 0.000 | 0.000 | 0.000 | 0.000 | 0.000 | 0.000 | 0.994 | 0.006 | ||
| 12 spectra, NLIEWLNK | 0.000 | 0.000 | 0.190 | 0.000 | 0.000 | 0.000 | 0.810 | 0.000 | ||
| 8 spectra, EDCSPADKPYIEEAR | 0.000 | 0.000 | 0.000 | 0.000 | 0.000 | 0.000 | 1.000 | 0.000 | ||
| 9 spectra, EVDAVLR | 0.000 | 0.000 | 0.205 | 0.000 | 0.000 | 0.000 | 0.795 | 0.000 | ||
| 6 spectra, LDYGGMGQEVQVEHIK | 0.000 | 0.000 | 0.222 | 0.000 | 0.000 | 0.000 | 0.778 | 0.000 | ||
| 11 spectra, SPVDAGK | 0.004 | 0.000 | 0.119 | 0.000 | 0.000 | 0.000 | 0.877 | 0.000 | ||
| 1 spectrum, ANEANPCPCDIGHR | 0.000 | 0.000 | 0.000 | 0.115 | 0.000 | 0.000 | 0.885 | 0.000 | ||
| 3 spectra, TFSGQTHGFVHR | 0.000 | 0.000 | 0.209 | 0.000 | 0.000 | 0.000 | 0.791 | 0.000 |
| Plot | Mito | Lyso or Perox | ER | Golgi | PM | Cytosol | Nucleus | ||||||
| Expt B |
6 peptides |
26 spectra |
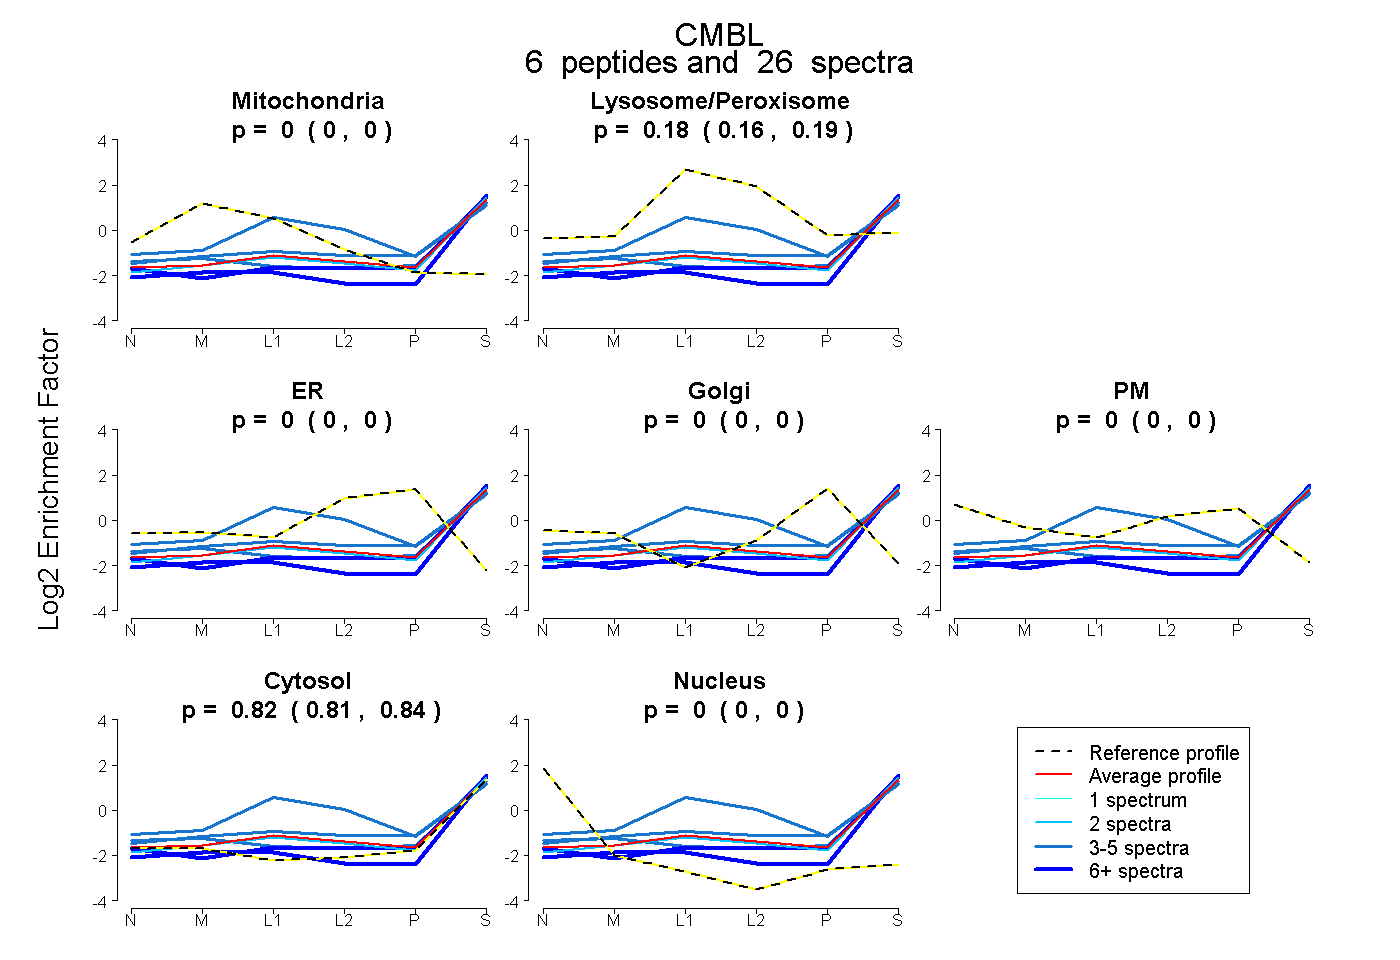 |
0.000 0.000 | 0.000 |
0.178 0.160 | 0.192 |
0.000 0.000 | 0.000 |
0.000 0.000 | 0.000 |
0.000 0.000 | 0.000 |
0.822 0.805 | 0.838 |
0.000 0.000 | 0.000 |
|||
| Plot | Lyso | Other | |||||||||||
| Expt C |
10 peptides |
160 spectra |
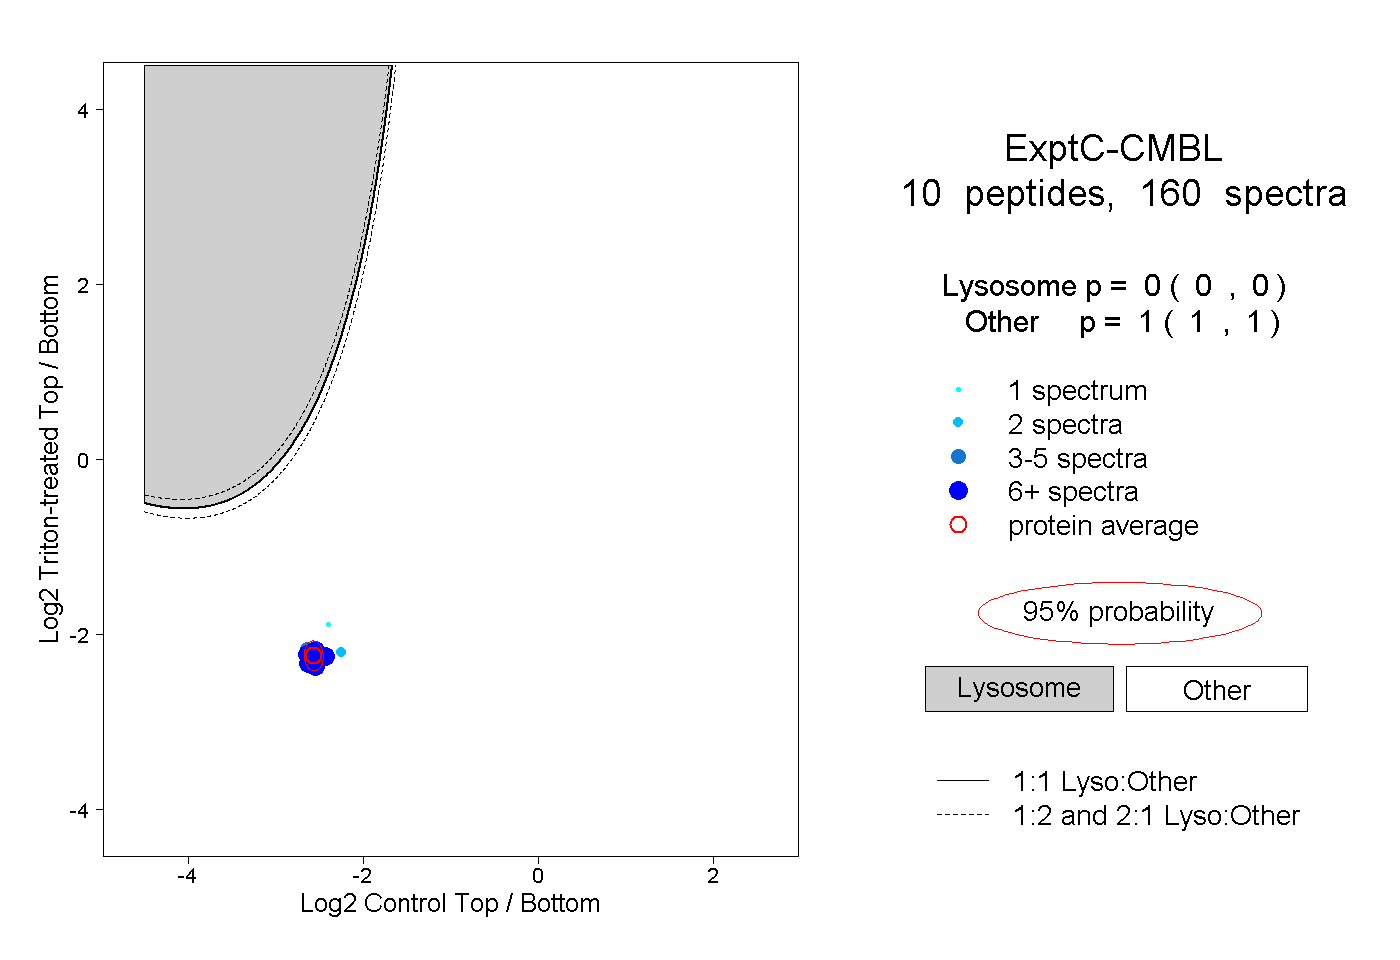 |
0.000 0.000 | 0.000 |
1.000 1.000 | 1.000 |
||||||||
| Plot | Lyso | Other | |||||||||||
| Expt D |
4 peptides |
6 spectra |
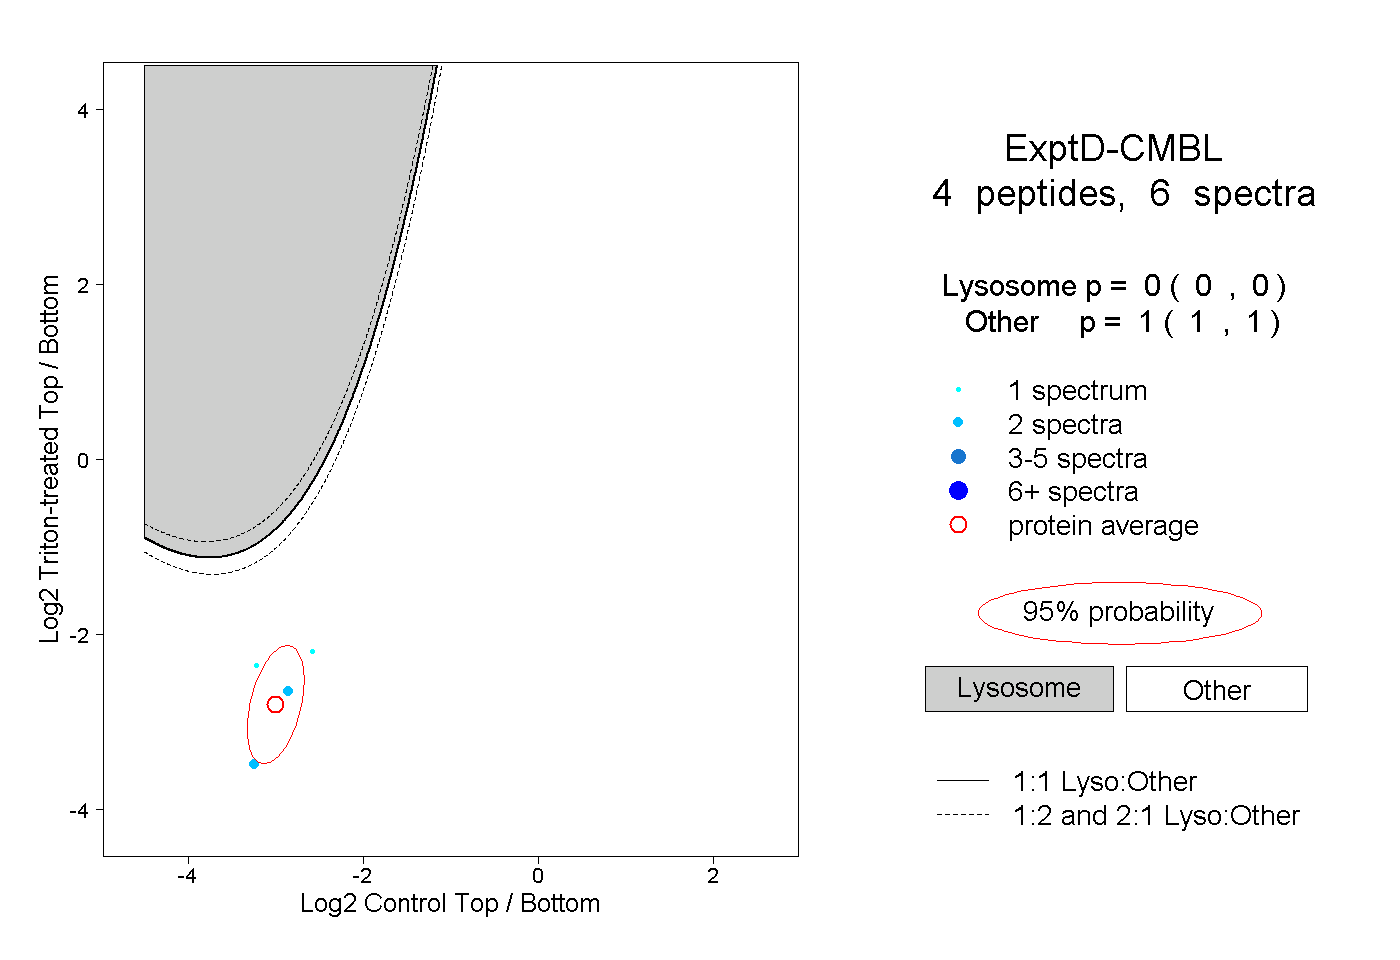 |
0.000 0.000 | 0.000 |
1.000 1.000 | 1.000 |