 8
8peptides
spectra
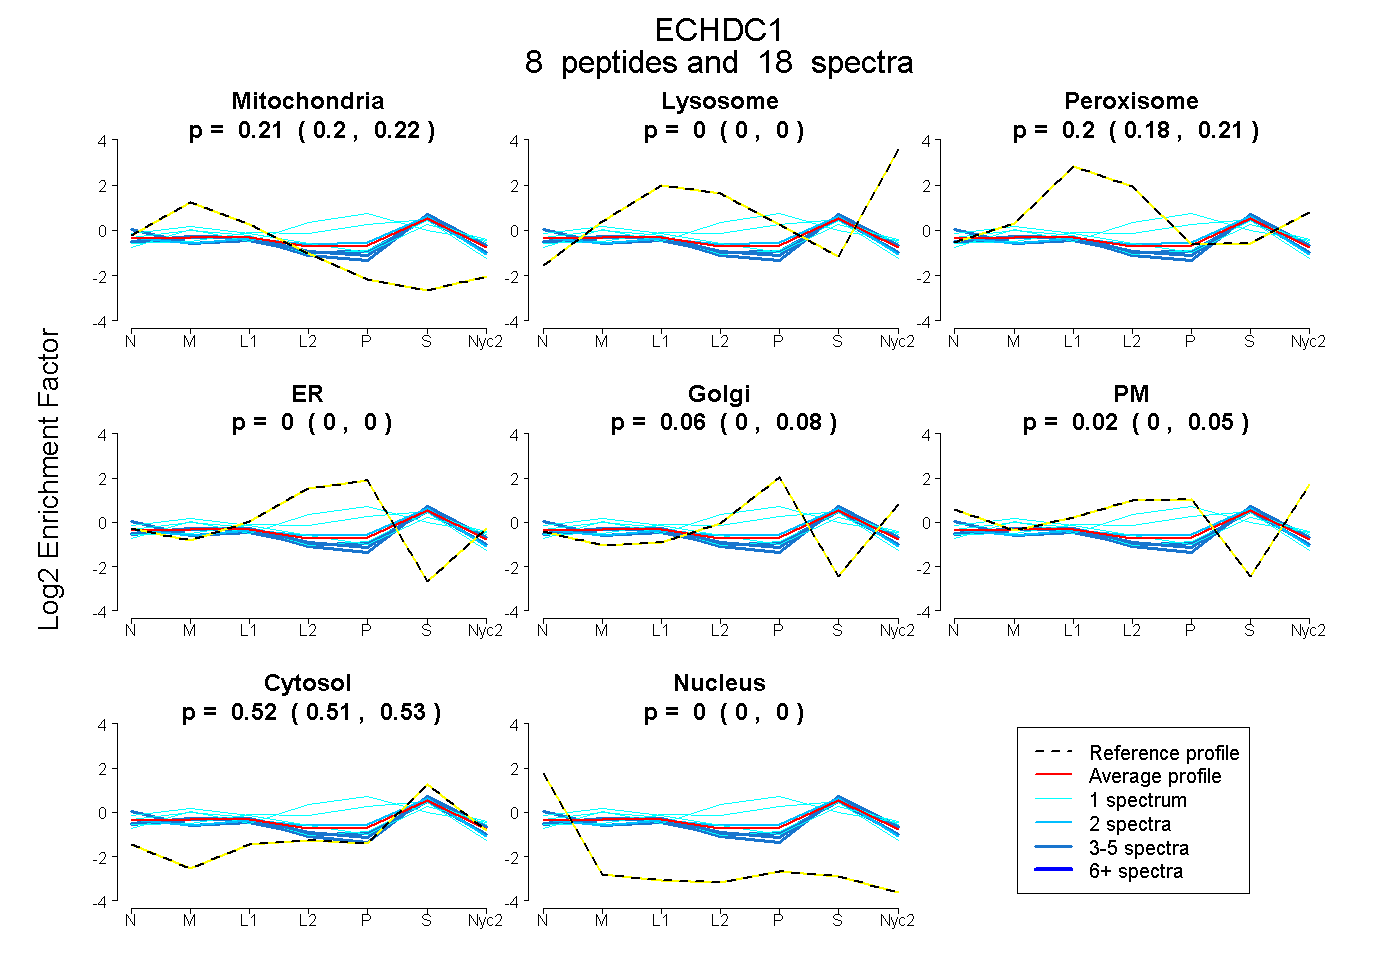
0.200 | 0.224
0.000 | 0.000
0.182 | 0.207
0.000 | 0.000
0.002 | 0.085
0.000 | 0.055
0.506 | 0.529
0.000 | 0.000
2peptides
spectra
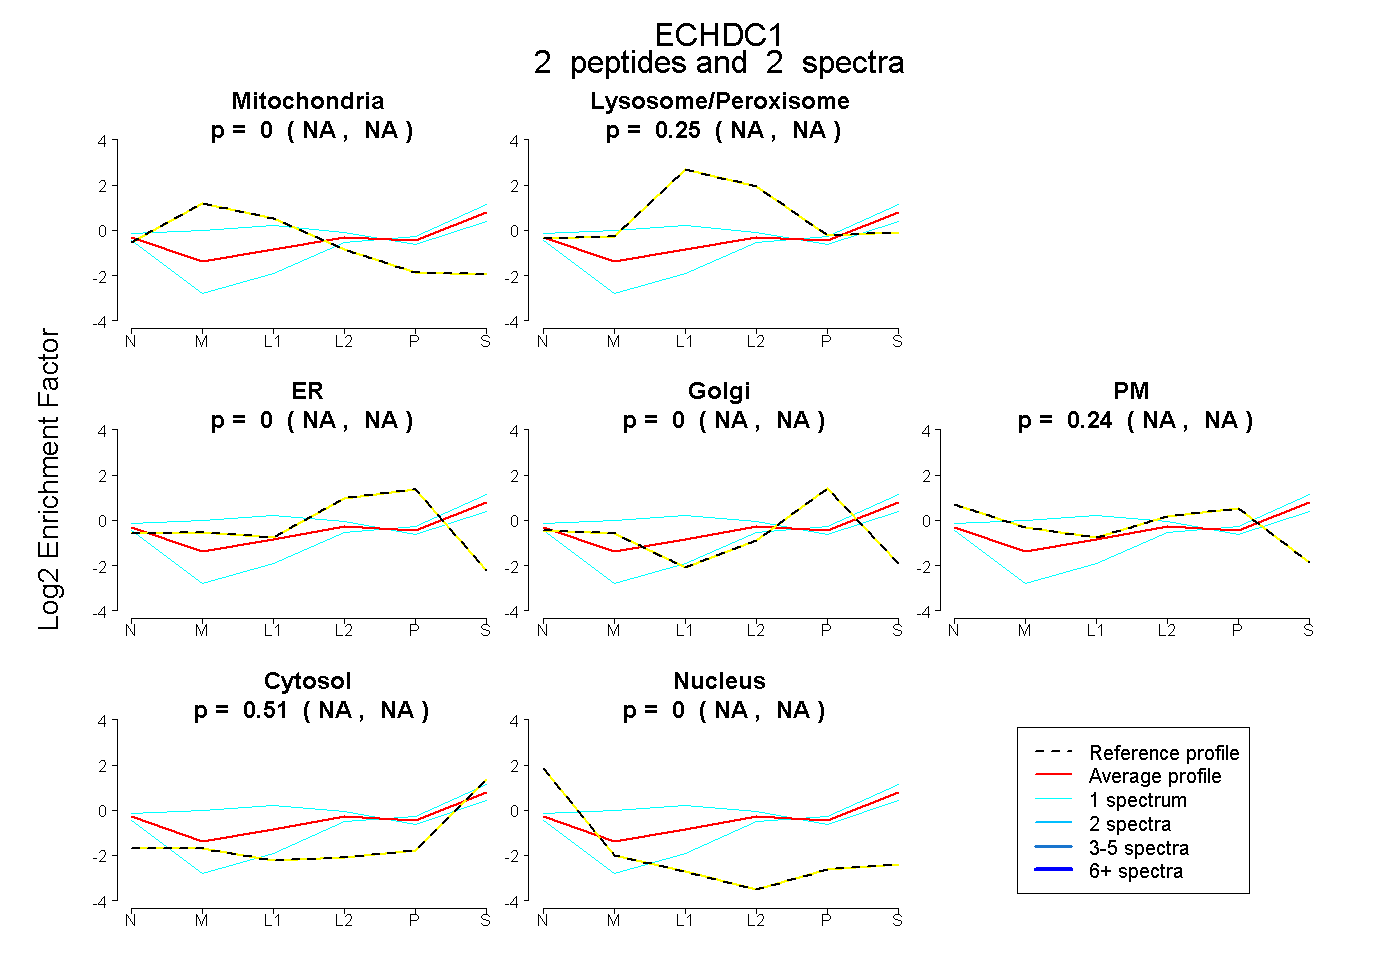
NA | NA
NA | NA
NA | NA
NA | NA
NA | NA
NA | NA
NA | NA
6peptides
spectra
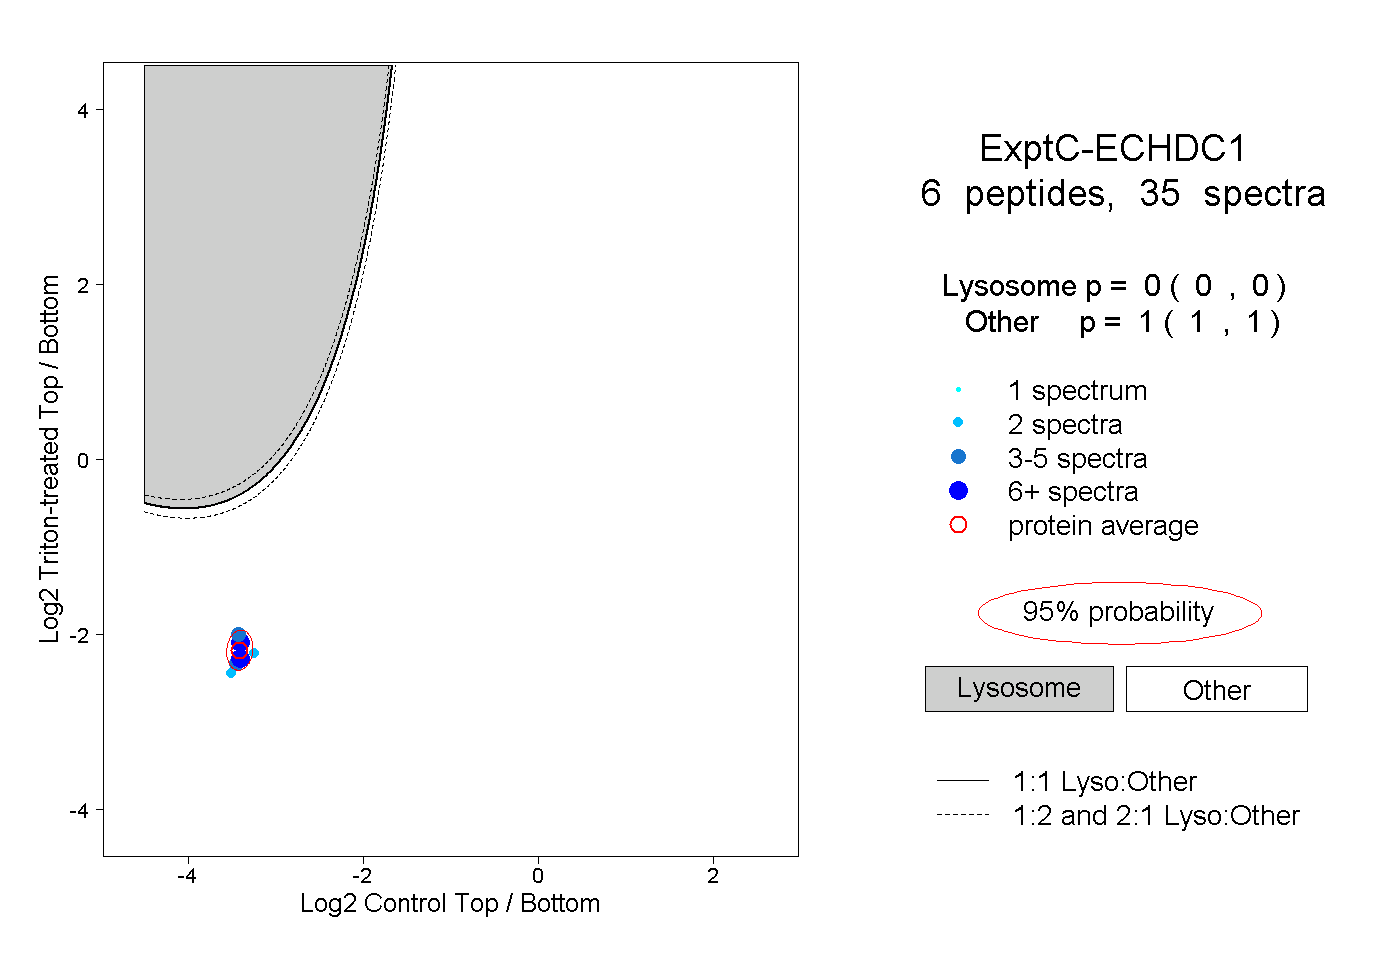
0.000 | 0.000
1.000 | 1.000
1peptide
spectrum
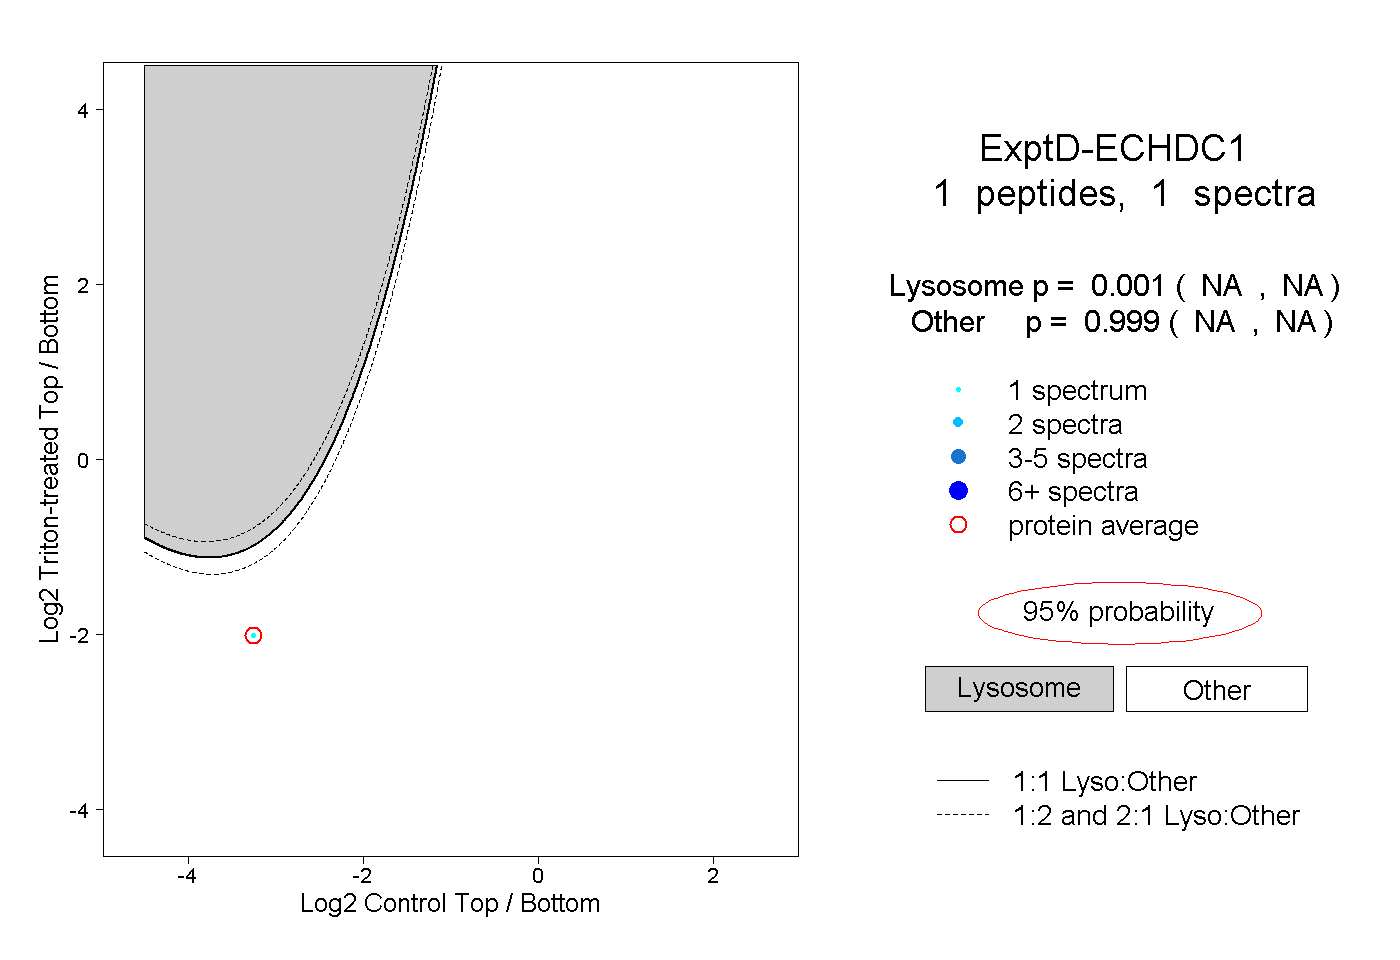
NA | NA
NA | NA