 8
8peptides
spectra
0.200 | 0.224
0.000 | 0.000
0.182 | 0.207
0.000 | 0.000
0.002 | 0.085
0.000 | 0.055
0.506 | 0.529
0.000 | 0.000
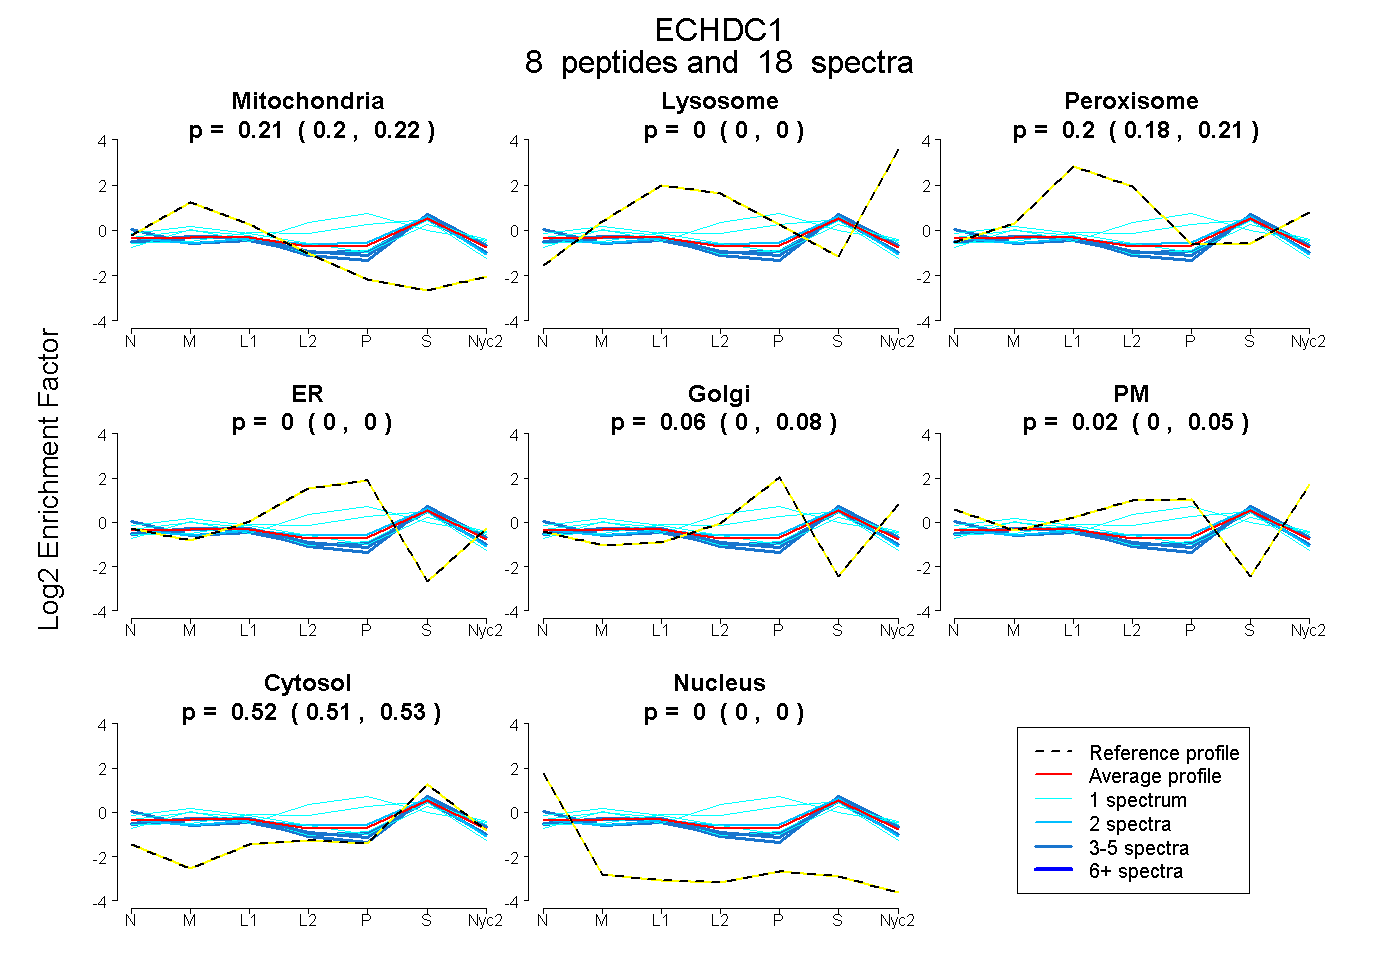
| Plot | Mito | Lyso | Perox | ER | Golgi | PM | Cytosol | Nucleus | |||||
| Expt A |
8 peptides |
18 spectra |
|
0.212 0.200 | 0.224 |
0.000 0.000 | 0.000 |
0.198 0.182 | 0.207 |
0.000 0.000 | 0.000 |
0.057 0.002 | 0.085 |
0.015 0.000 | 0.055 |
0.517 0.506 | 0.529 |
0.000 0.000 | 0.000 |
| 3 spectra, ELYLEEALQNER | 0.234 | 0.000 | 0.131 | 0.000 | 0.000 | 0.063 | 0.544 | 0.028 | ||
| 4 spectra, EMGIVPSWGGASR | 0.252 | 0.001 | 0.170 | 0.000 | 0.000 | 0.000 | 0.576 | 0.000 | ||
| 1 spectrum, GLIVHGAK | 0.348 | 0.000 | 0.148 | 0.000 | 0.006 | 0.000 | 0.498 | 0.000 | ||
| 1 spectrum, VLSGTFK | 0.272 | 0.000 | 0.222 | 0.000 | 0.000 | 0.090 | 0.417 | 0.000 | ||
| 1 spectrum, LVEIIGSR | 0.054 | 0.000 | 0.204 | 0.231 | 0.176 | 0.000 | 0.335 | 0.000 | ||
| 1 spectrum, NTFCSGSDLNAVK | 0.039 | 0.000 | 0.262 | 0.100 | 0.142 | 0.000 | 0.457 | 0.000 | ||
| 5 spectra, LMTEESVIR | 0.241 | 0.004 | 0.199 | 0.000 | 0.000 | 0.000 | 0.556 | 0.000 | ||
| 2 spectra, VIELENWTEGK | 0.188 | 0.000 | 0.165 | 0.088 | 0.001 | 0.000 | 0.558 | 0.000 |
| Plot | Mito | Lyso or Perox | ER | Golgi | PM | Cytosol | Nucleus | ||||||
| Expt B |
2 peptides |
2 spectra |
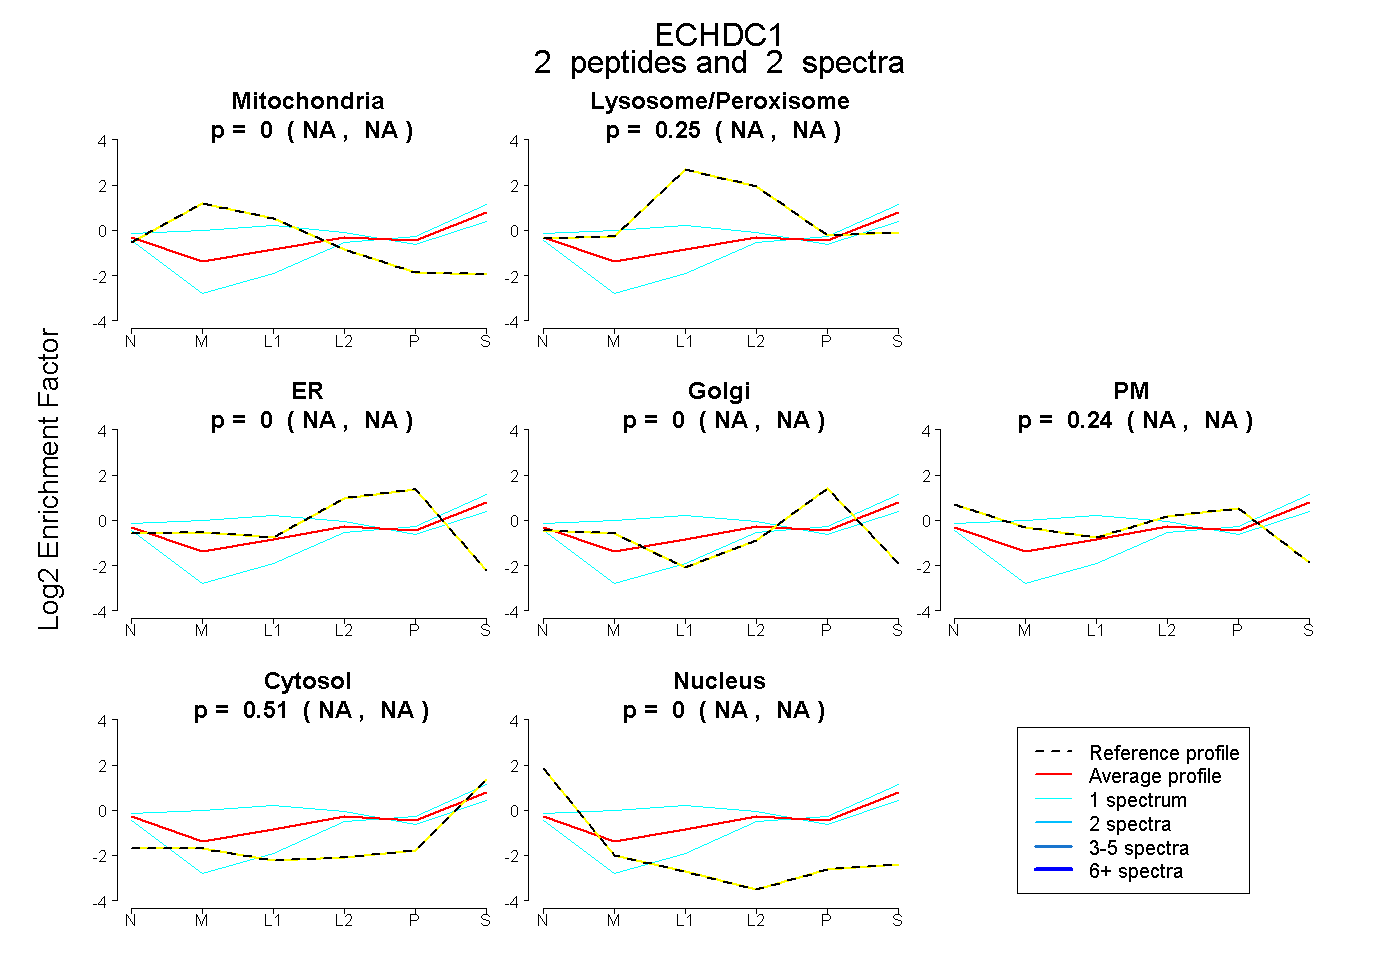 |
0.000 NA | NA |
0.246 NA | NA |
0.000 NA | NA |
0.000 NA | NA |
0.242 NA | NA |
0.512 NA | NA |
0.000 NA | NA |
|||
| Plot | Lyso | Other | |||||||||||
| Expt C |
6 peptides |
35 spectra |
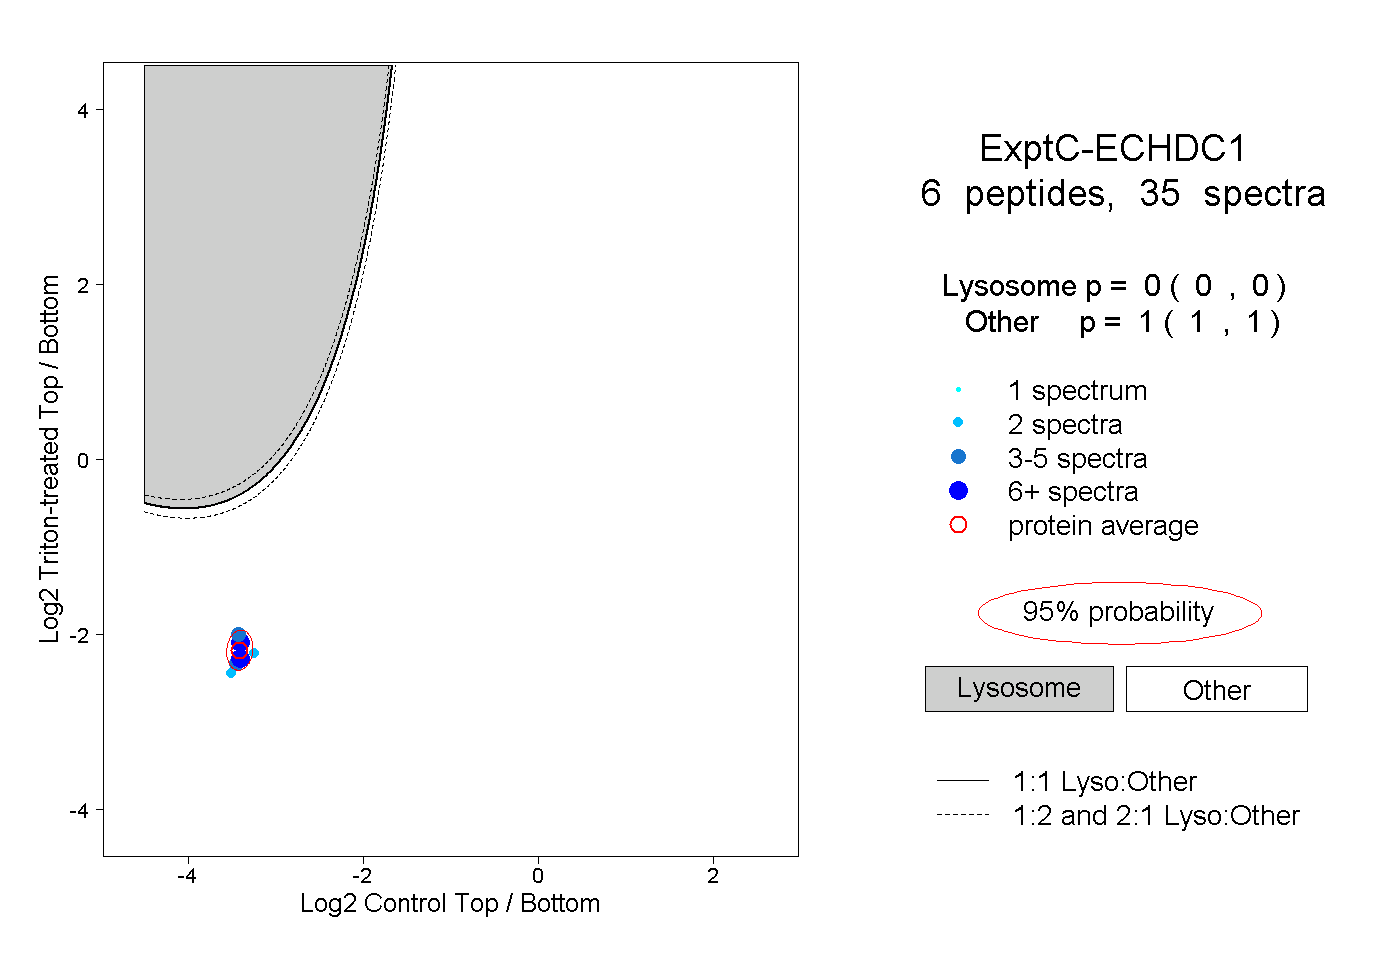 |
0.000 0.000 | 0.000 |
1.000 1.000 | 1.000 |
||||||||
| Plot | Lyso | Other | |||||||||||
| Expt D |
1 peptide |
1 spectrum |
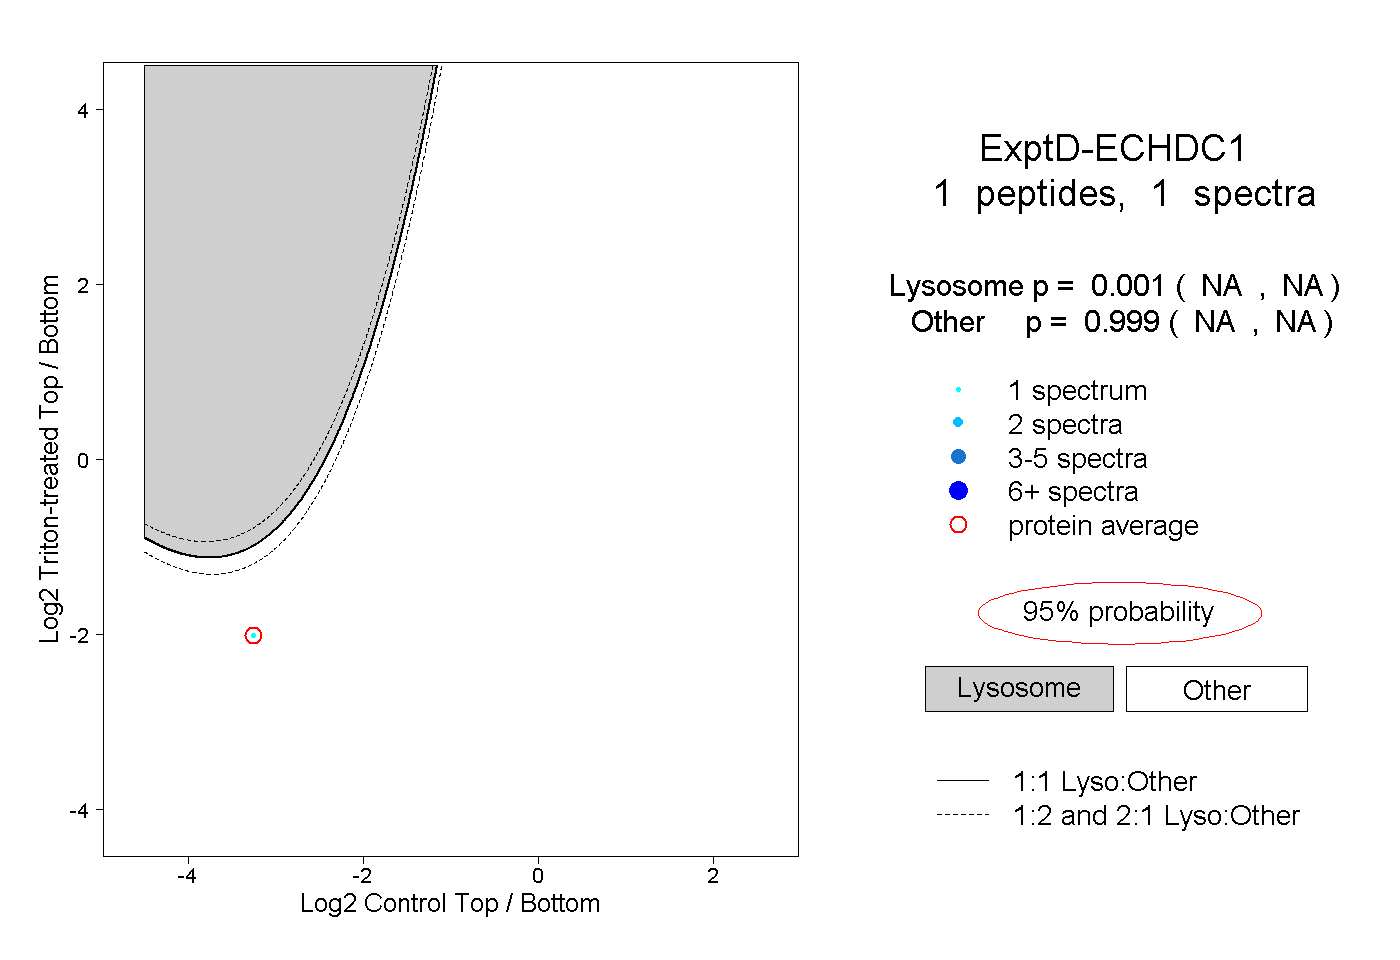 |
0.001 NA | NA |
0.999 NA | NA |