 9
9peptides
spectra
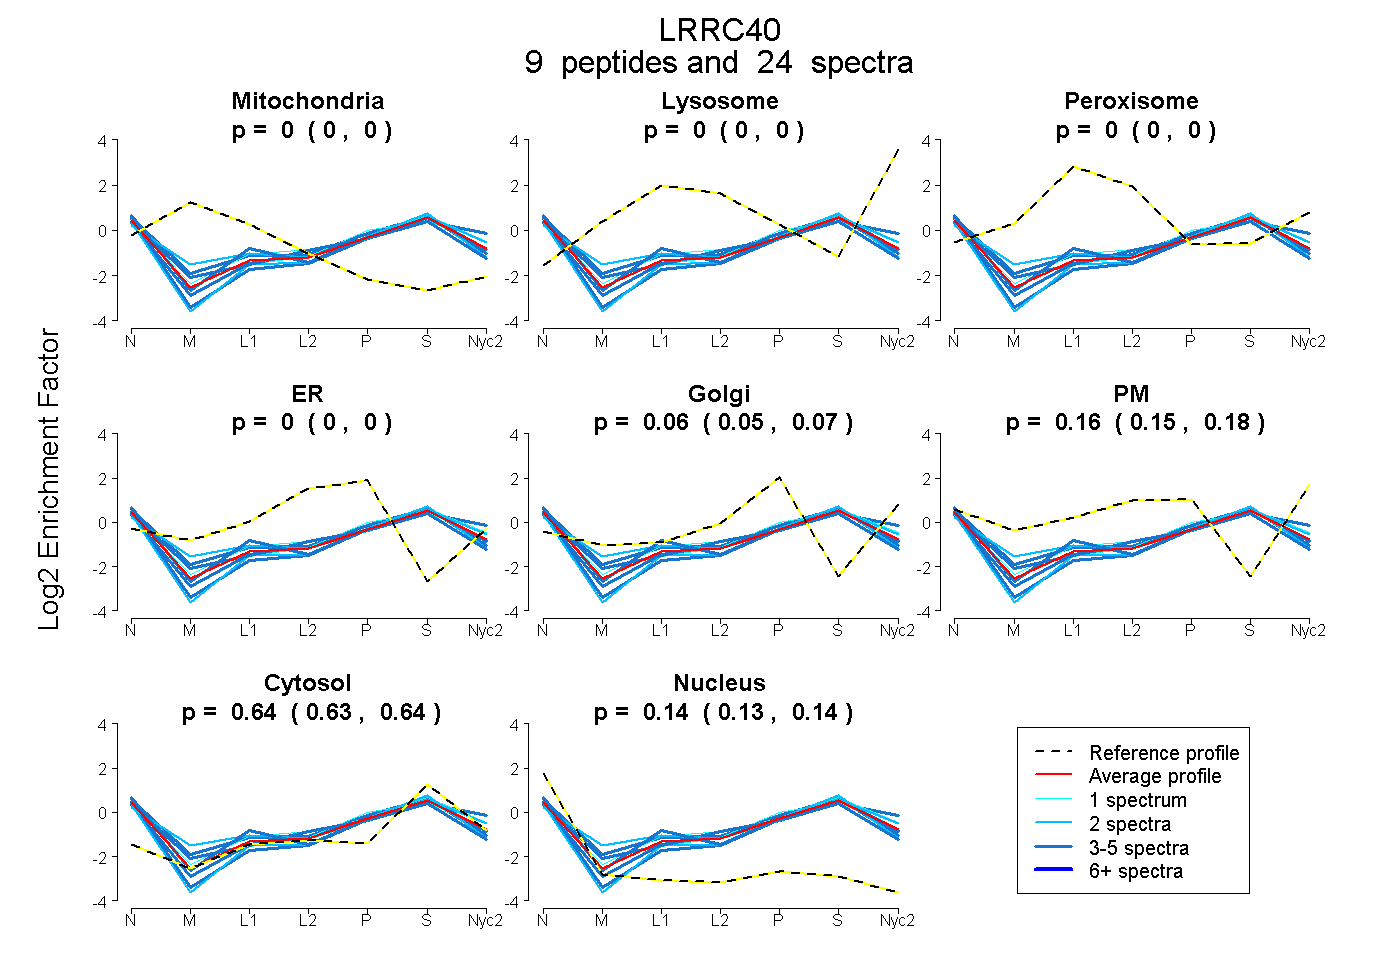
0.000 | 0.000
0.000 | 0.000
0.000 | 0.000
0.000 | 0.000
0.046 | 0.071
0.147 | 0.176
0.635 | 0.643
0.134 | 0.142
5peptides
spectra
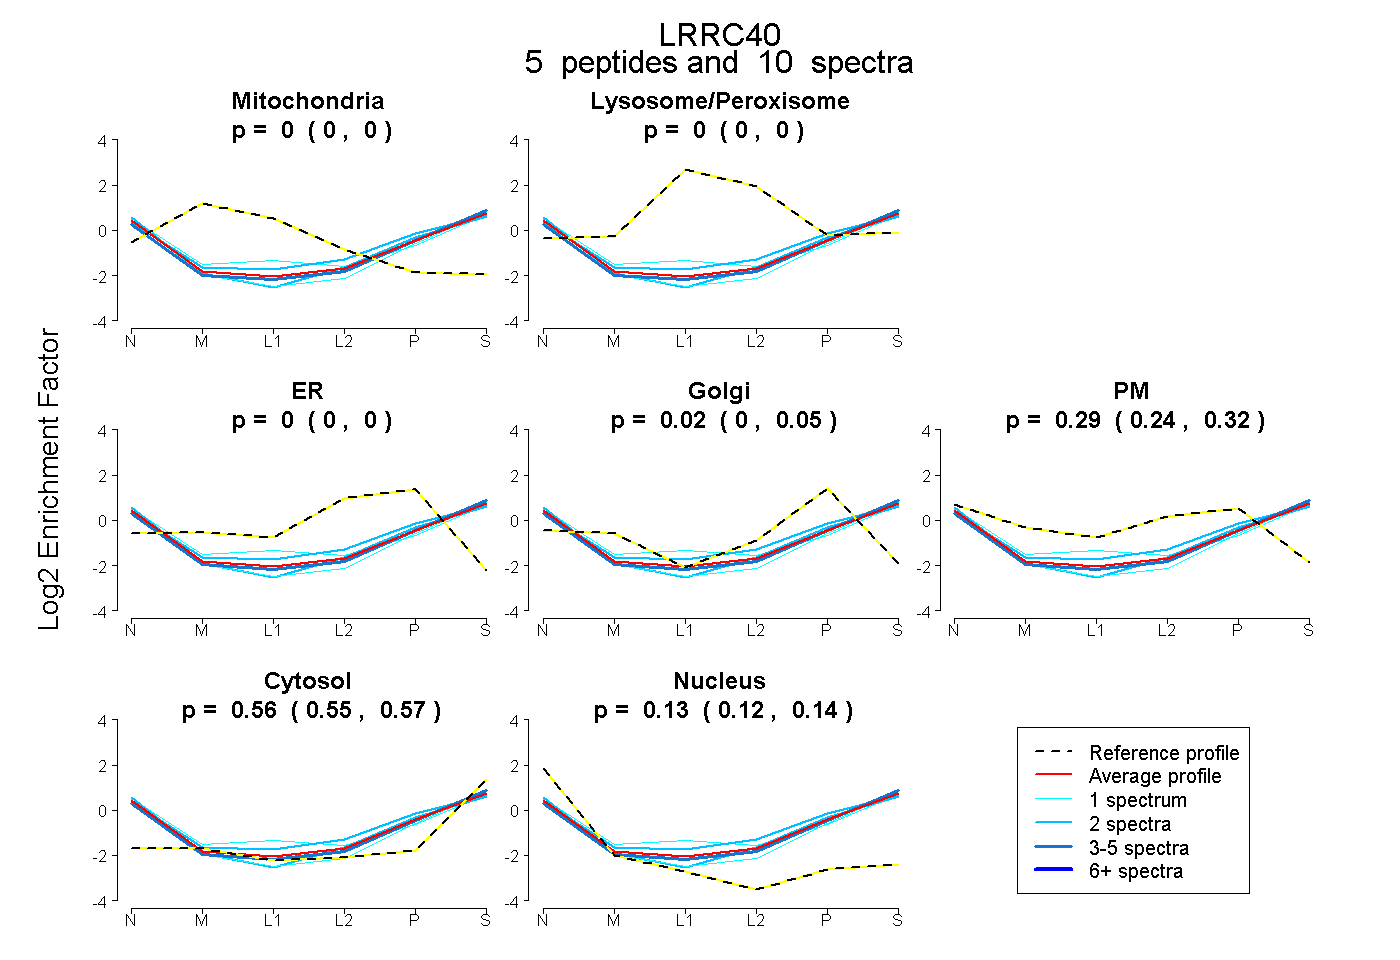
0.000 | 0.000
0.000 | 0.000
0.000 | 0.000
0.000 | 0.052
0.243 | 0.319
0.552 | 0.570
0.115 | 0.139
7peptides
spectra
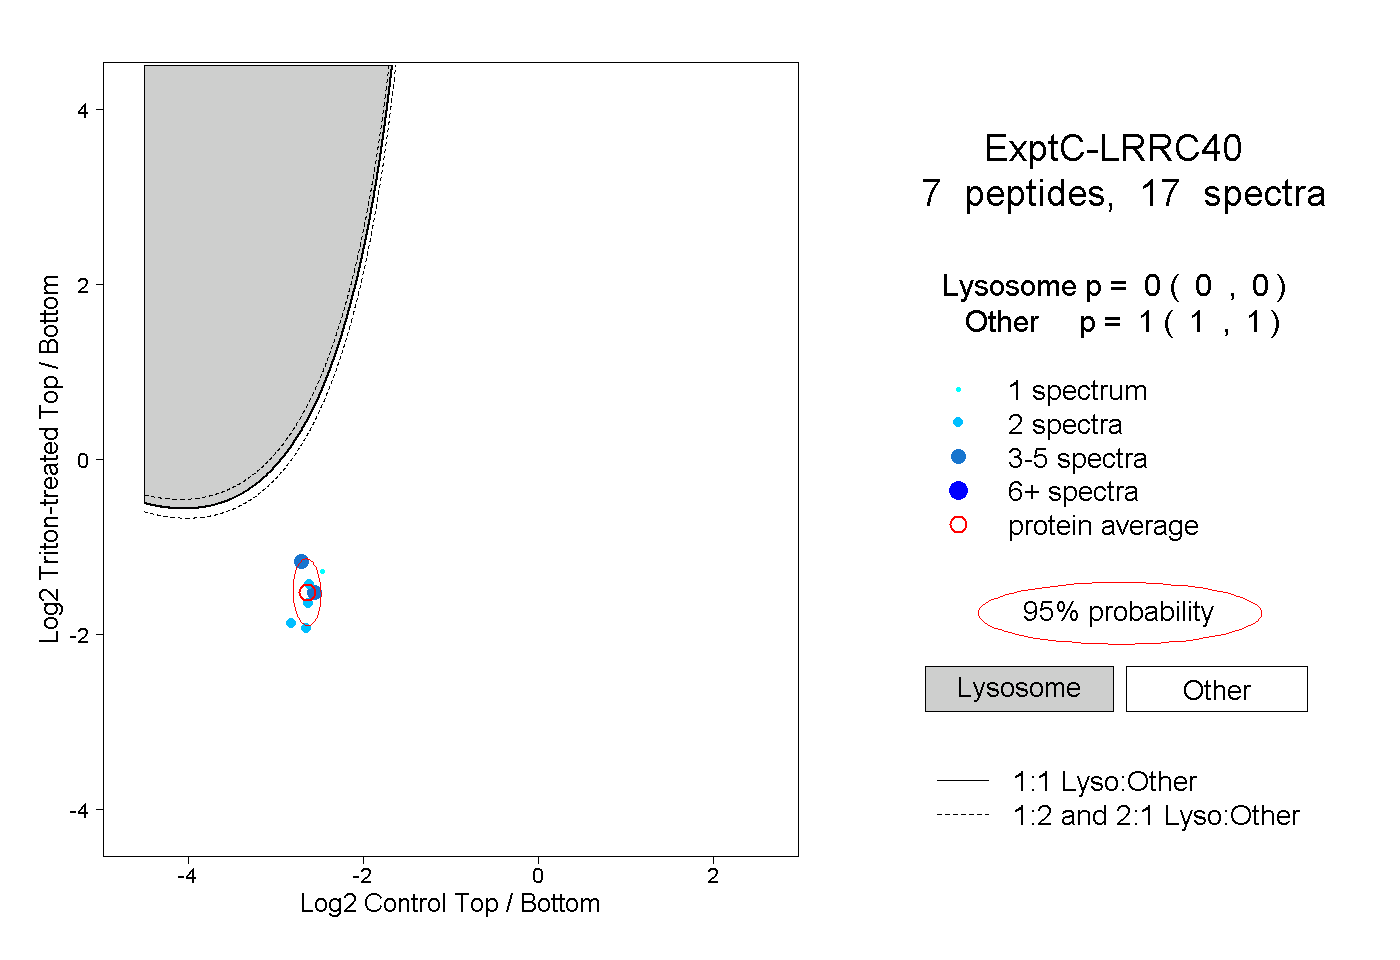
0.000 | 0.000
1.000 | 1.000