LRRC40
[ENSRNOP00000015434]
Main page
| | | Plot |
Mito |
Lyso |
|
Perox |
ER |
Golgi |
PM |
Cytosol |
Nucleus |
|
| Expt A |
 9
9
peptides |
24
spectra |
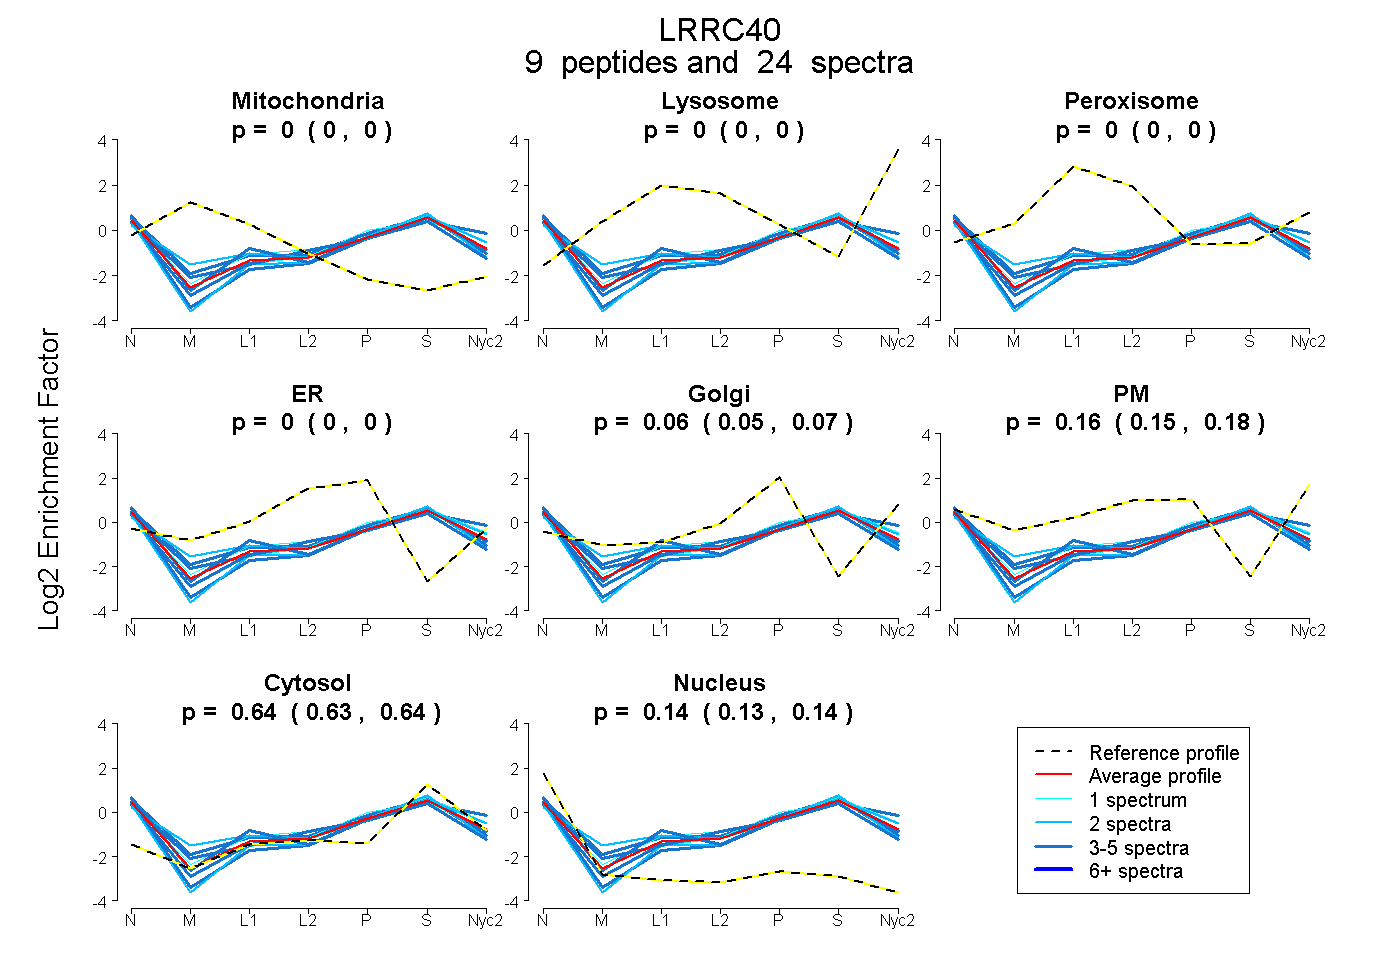 |
0.000
0.000 | 0.000 |
0.000
0.000 | 0.000 |
|
0.000
0.000 | 0.000 |
0.000
0.000 | 0.000 |
0.059
0.046 | 0.071 |
0.163
0.147 | 0.176 |
0.640
0.635 | 0.643 |
0.138
0.134 | 0.142 |
|
| | | Plot |
Mito |
|
Lyso or Perox |
|
ER |
Golgi |
PM |
Cytosol |
Nucleus |
|
| Expt B |
5
peptides |
10
spectra |
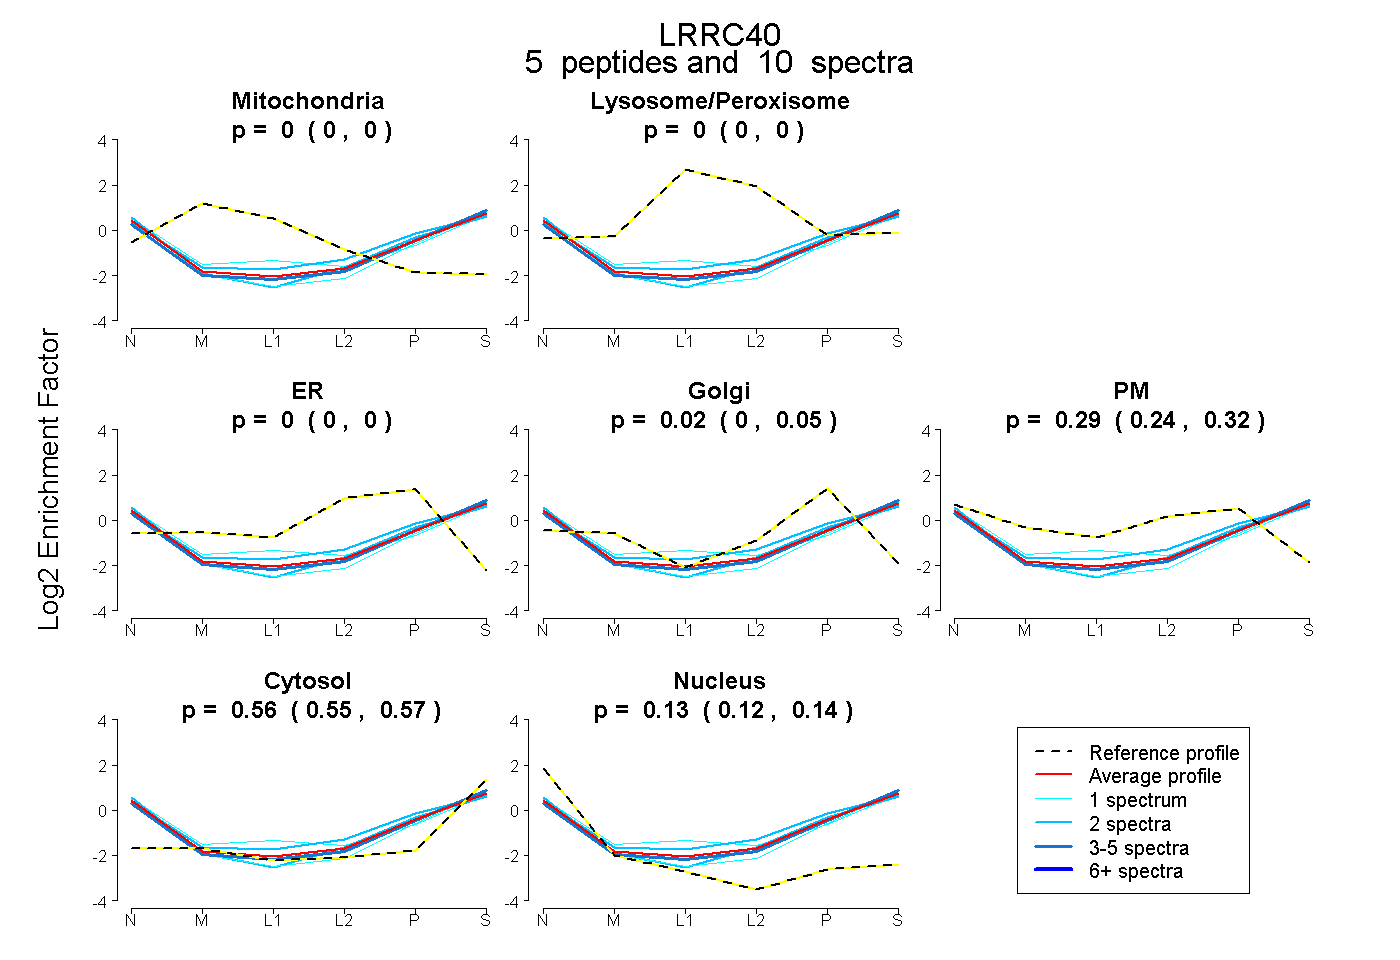 |
0.000
0.000 | 0.000 |
|
0.000
0.000 | 0.000 |
|
0.000
0.000 | 0.000 |
0.017
0.000 | 0.052 |
0.292
0.243 | 0.319 |
0.563
0.552 | 0.570 |
0.128
0.115 | 0.139 |
|
| 4 spectra, TLLLDGNPFR |
0.000 |
|
0.000 |
|
0.000 |
0.070 |
0.195 |
0.605 |
0.130 |
|
| 1 spectrum, LAFLDLR |
0.000 |
|
0.000 |
|
0.000 |
0.135 |
0.076 |
0.575 |
0.214 |
|
| 2 spectra, GTAAVLEYLR |
0.000 |
|
0.000 |
|
0.000 |
0.000 |
0.423 |
0.537 |
0.040 |
|
| 2 spectra, FLALEGNPLR |
0.000 |
|
0.000 |
|
0.000 |
0.161 |
0.162 |
0.507 |
0.170 |
|
| 1 spectrum, ELYLAENQIEK |
0.000 |
|
0.115 |
|
0.000 |
0.000 |
0.228 |
0.488 |
0.169 |
|
| | | Plot |
|
Lyso |
|
|
|
|
|
|
|
Other |
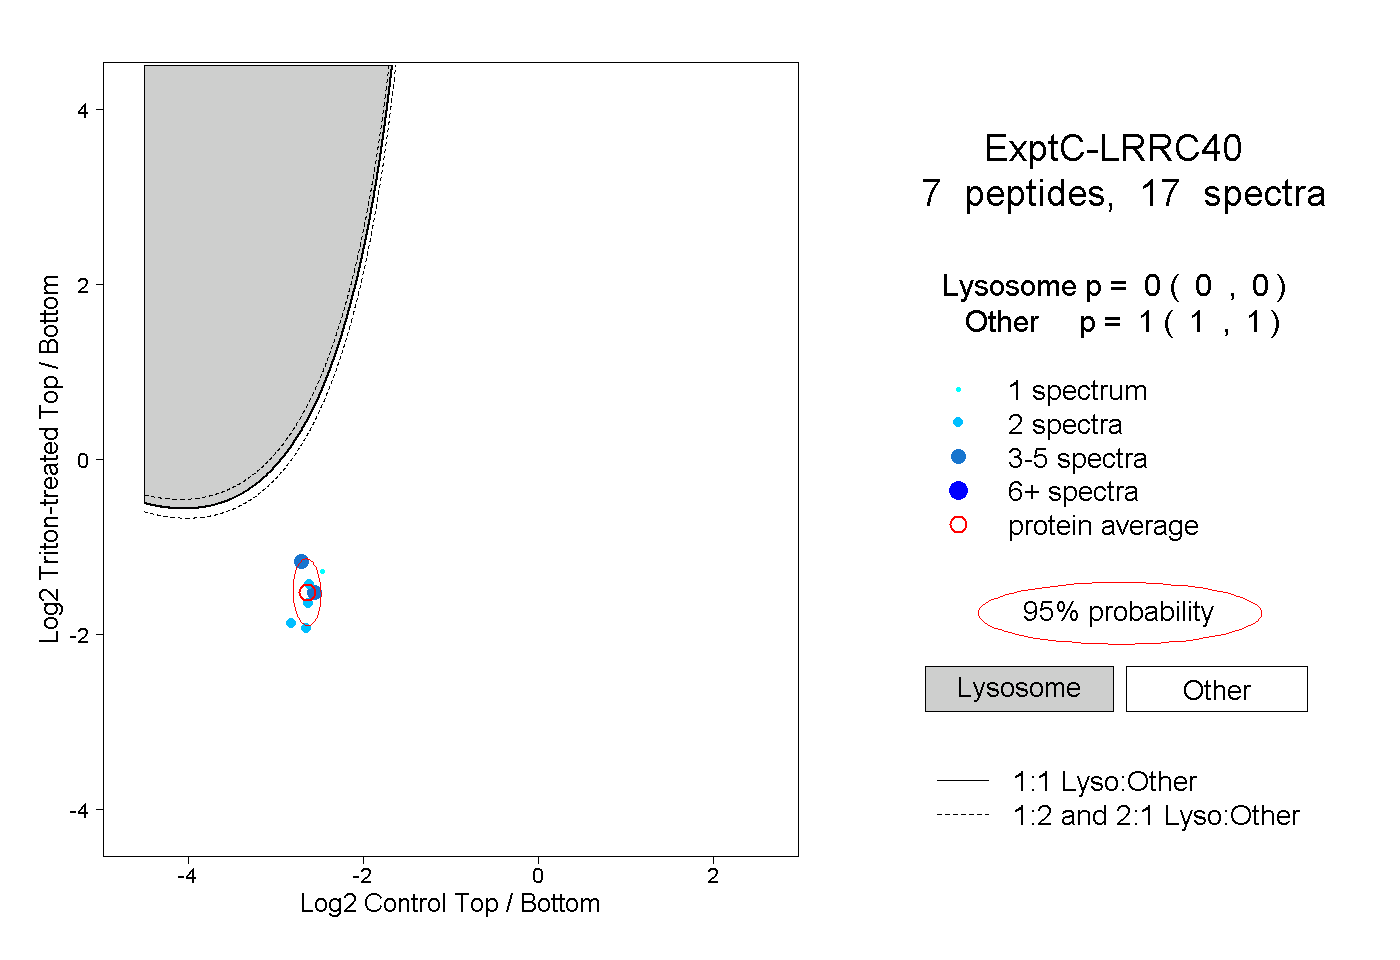
| Expt C |
7
peptides |
17
spectra |
 |
|
0.000
0.000 | 0.000 |
|
|
|
|
|
|
|
1.000
1.000 | 1.000 |