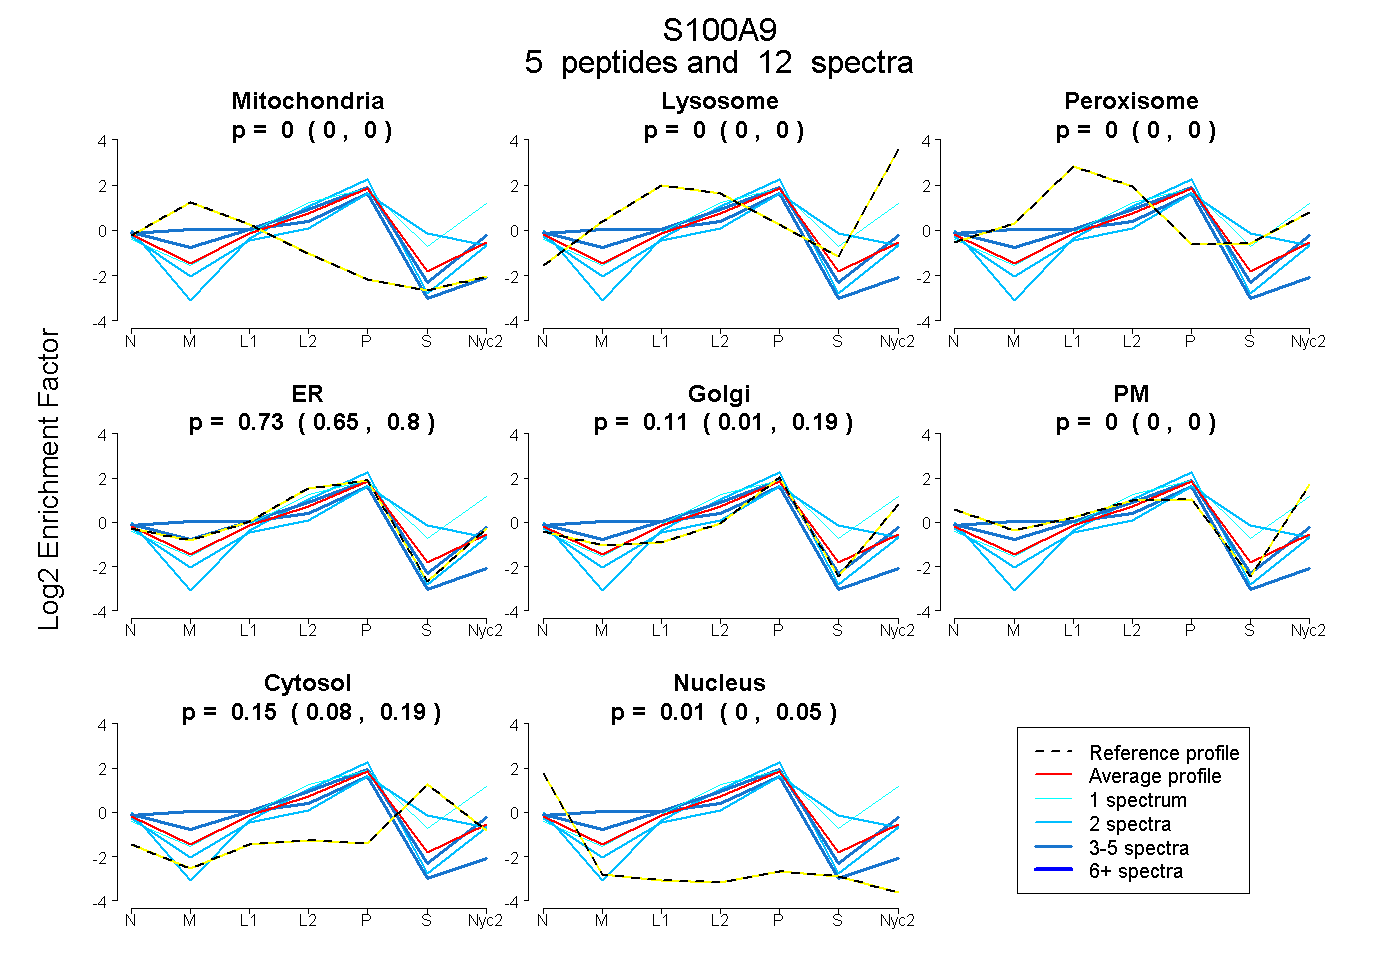
 5
5peptides
spectra
0.000 | 0.000
0.000 | 0.000
0.000 | 0.000
0.654 | 0.802
0.006 | 0.190
0.000 | 0.000
0.078 | 0.188
0.000 | 0.047
7peptides
spectra
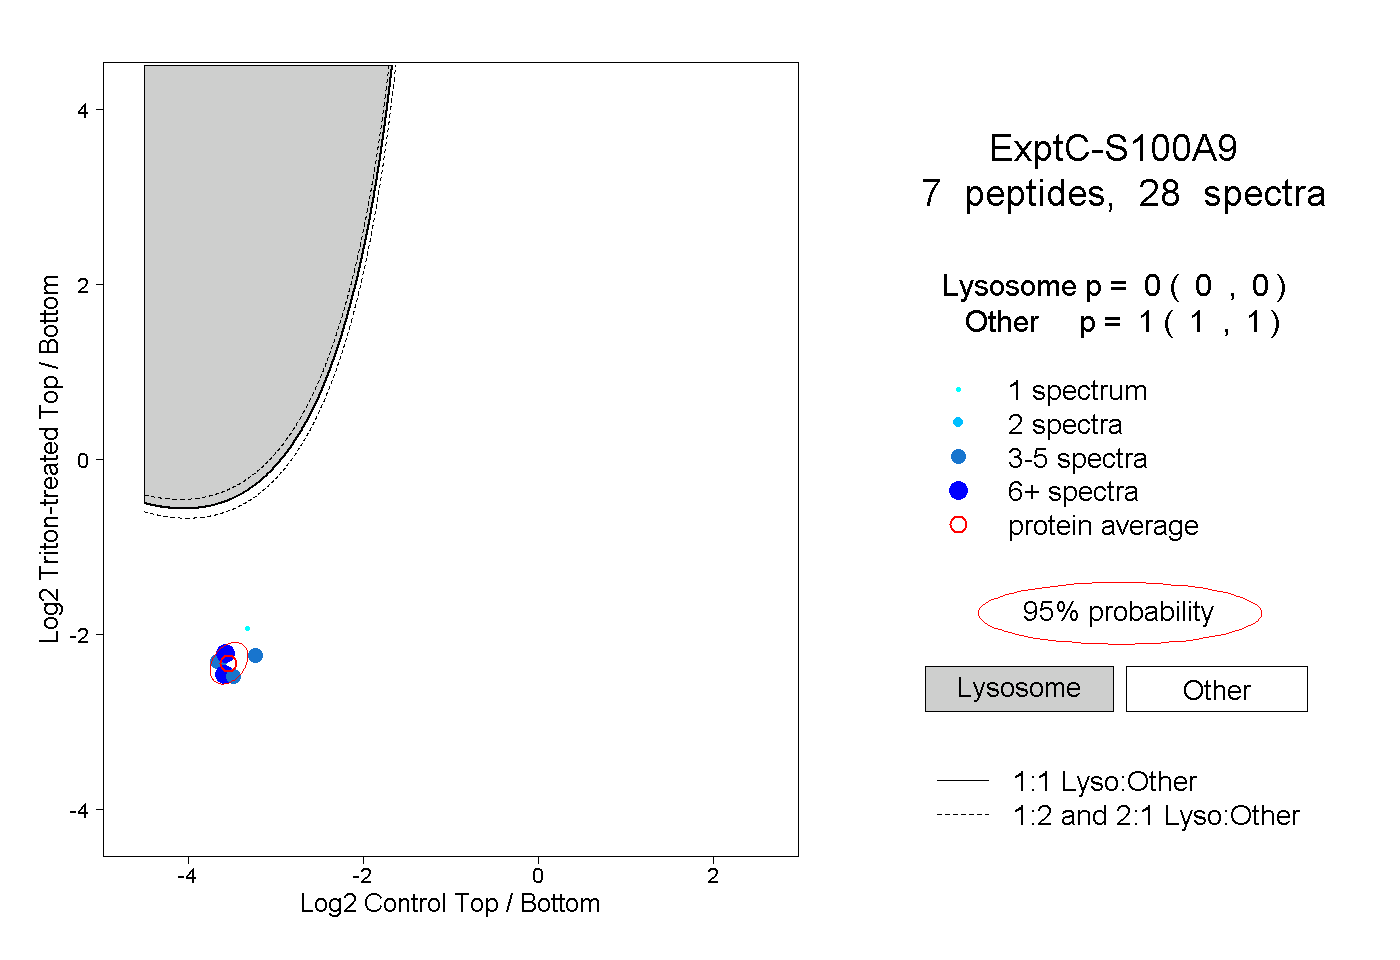
0.000 | 0.000
1.000 | 1.000
| Plot | Mito | Lyso | Perox | ER | Golgi | PM | Cytosol | Nucleus | |||||
| Expt A |
5 peptides |
12 spectra |
|
0.000 0.000 | 0.000 |
0.000 0.000 | 0.000 |
0.000 0.000 | 0.000 |
0.734 0.654 | 0.802 |
0.107 0.006 | 0.190 |
0.000 0.000 | 0.000 |
0.146 0.078 | 0.188 |
0.014 0.000 | 0.047 |
||
| Plot | Lyso | Other | |||||||||||
| Expt C |
7 peptides |
28 spectra |
|
0.000 0.000 | 0.000 |
1.000 1.000 | 1.000 |