 5
5peptides
spectra
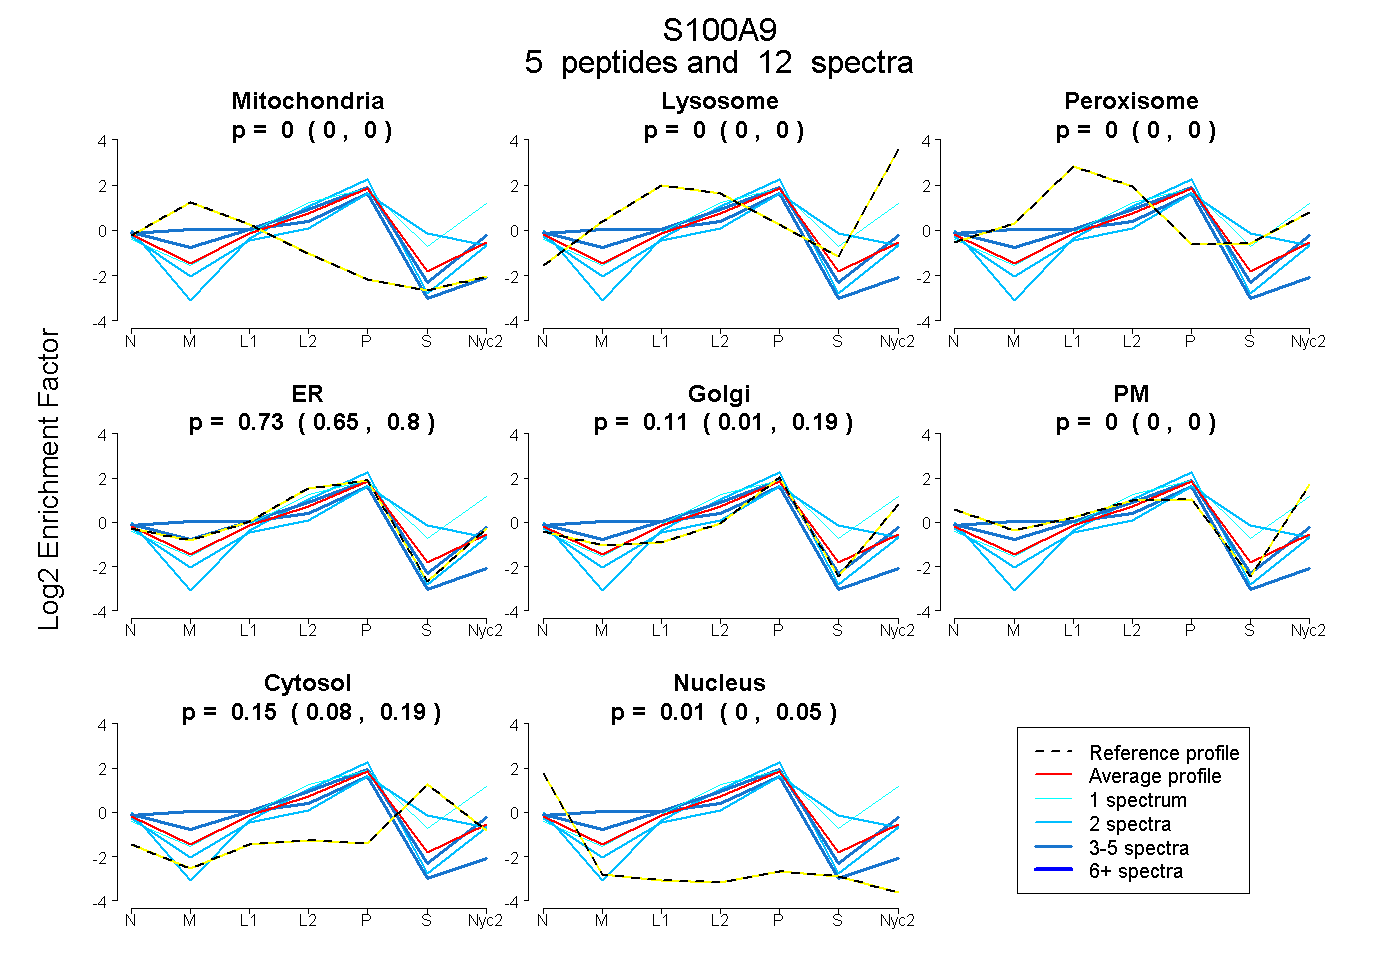
0.000 | 0.000
0.000 | 0.000
0.000 | 0.000
0.654 | 0.802
0.006 | 0.190
0.000 | 0.000
0.078 | 0.188
0.000 | 0.047
| Plot | Mito | Lyso | Perox | ER | Golgi | PM | Cytosol | Nucleus | |||||
| Expt A |
5 peptides |
12 spectra |
|
0.000 0.000 | 0.000 |
0.000 0.000 | 0.000 |
0.000 0.000 | 0.000 |
0.734 0.654 | 0.802 |
0.107 0.006 | 0.190 |
0.000 0.000 | 0.000 |
0.146 0.078 | 0.188 |
0.014 0.000 | 0.047 |
| 4 spectra, NENLLR | 0.001 | 0.000 | 0.050 | 0.708 | 0.214 | 0.000 | 0.000 | 0.028 | ||
| 1 spectrum, TGSQLER | 0.000 | 0.227 | 0.000 | 0.336 | 0.279 | 0.000 | 0.158 | 0.000 | ||
| 2 spectra, DLPNFLK | 0.000 | 0.000 | 0.000 | 0.771 | 0.121 | 0.000 | 0.000 | 0.108 | ||
| 3 spectra, LIFACHEK | 0.241 | 0.000 | 0.000 | 0.709 | 0.000 | 0.000 | 0.000 | 0.051 | ||
| 2 spectra, YGHPDTLNK | 0.000 | 0.000 | 0.000 | 0.464 | 0.112 | 0.000 | 0.424 | 0.000 |
| Plot | Lyso | Other | |||||||||||
| Expt C |
7 peptides |
28 spectra |
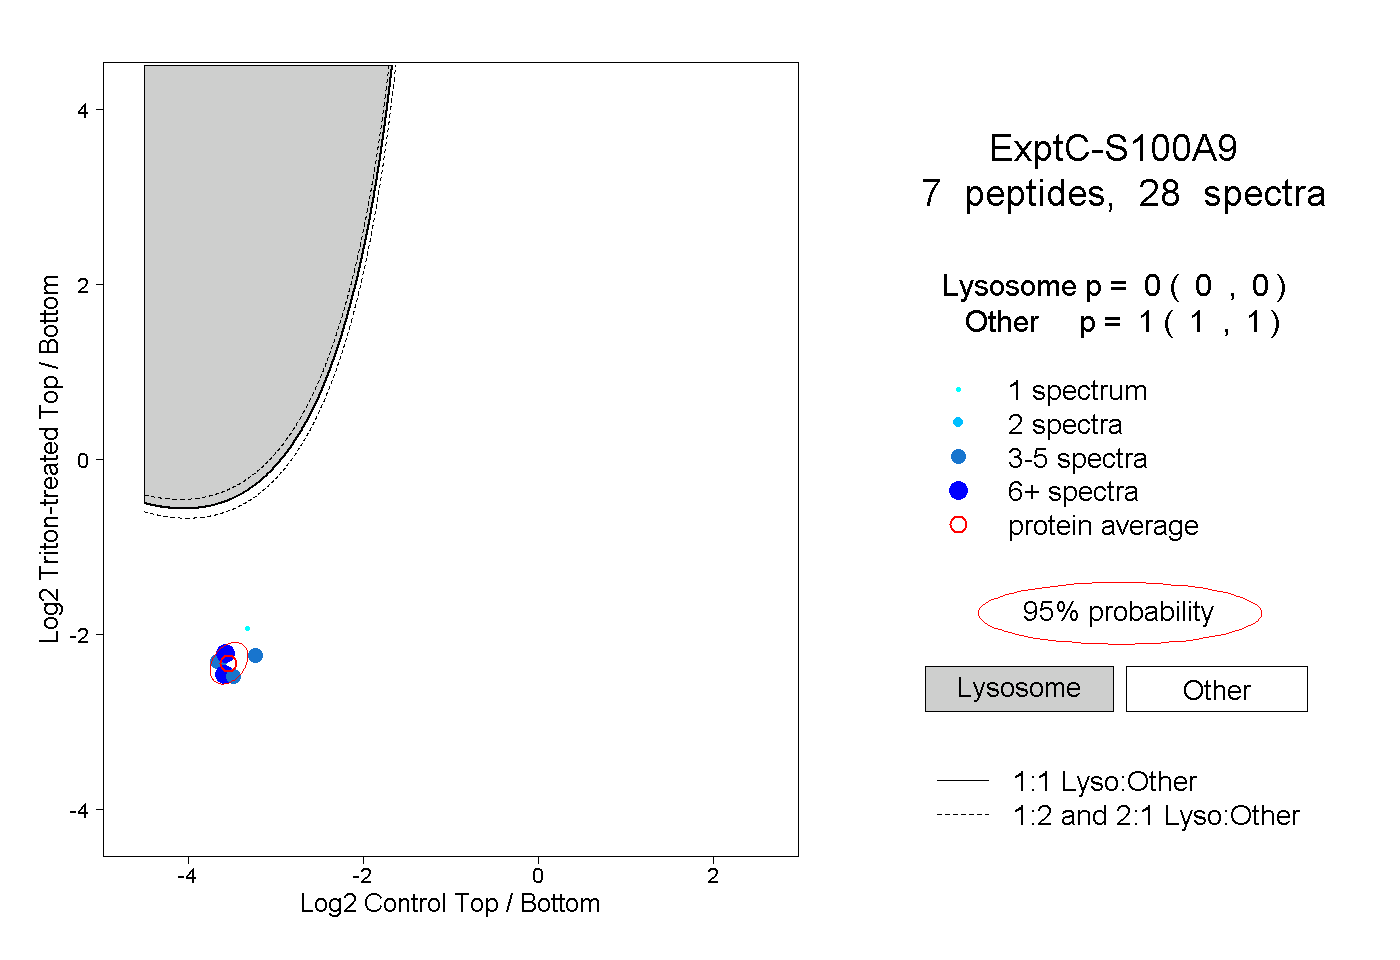 |
0.000 0.000 | 0.000 |
1.000 1.000 | 1.000 |