 3
3peptides
spectra
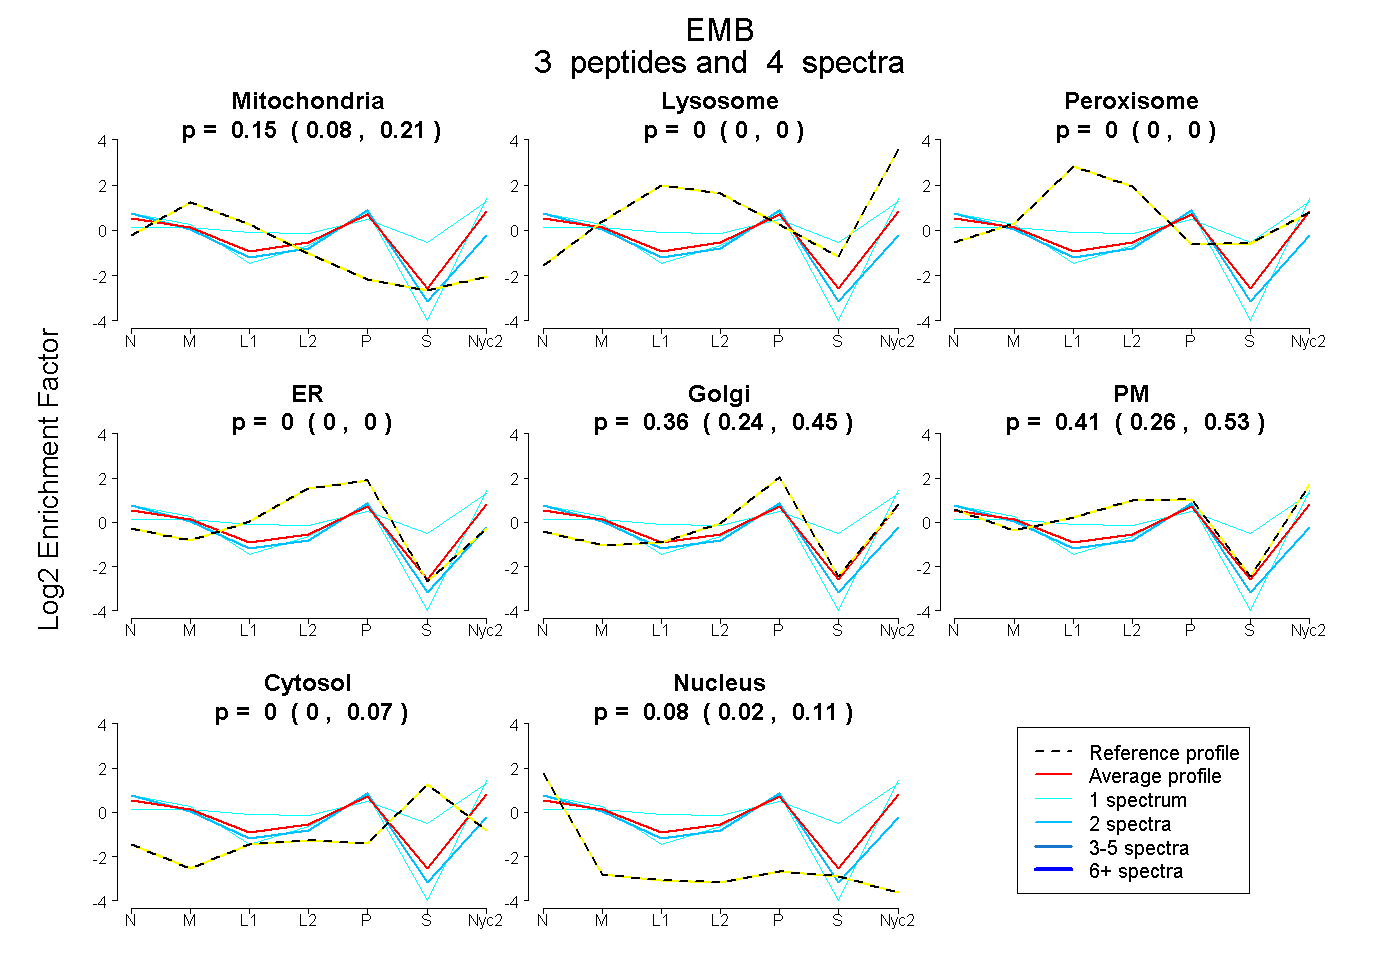
0.081 | 0.209
0.000 | 0.000
0.000 | 0.000
0.000 | 0.000
0.237 | 0.448
0.263 | 0.533
0.000 | 0.073
0.021 | 0.107
2peptides
spectra
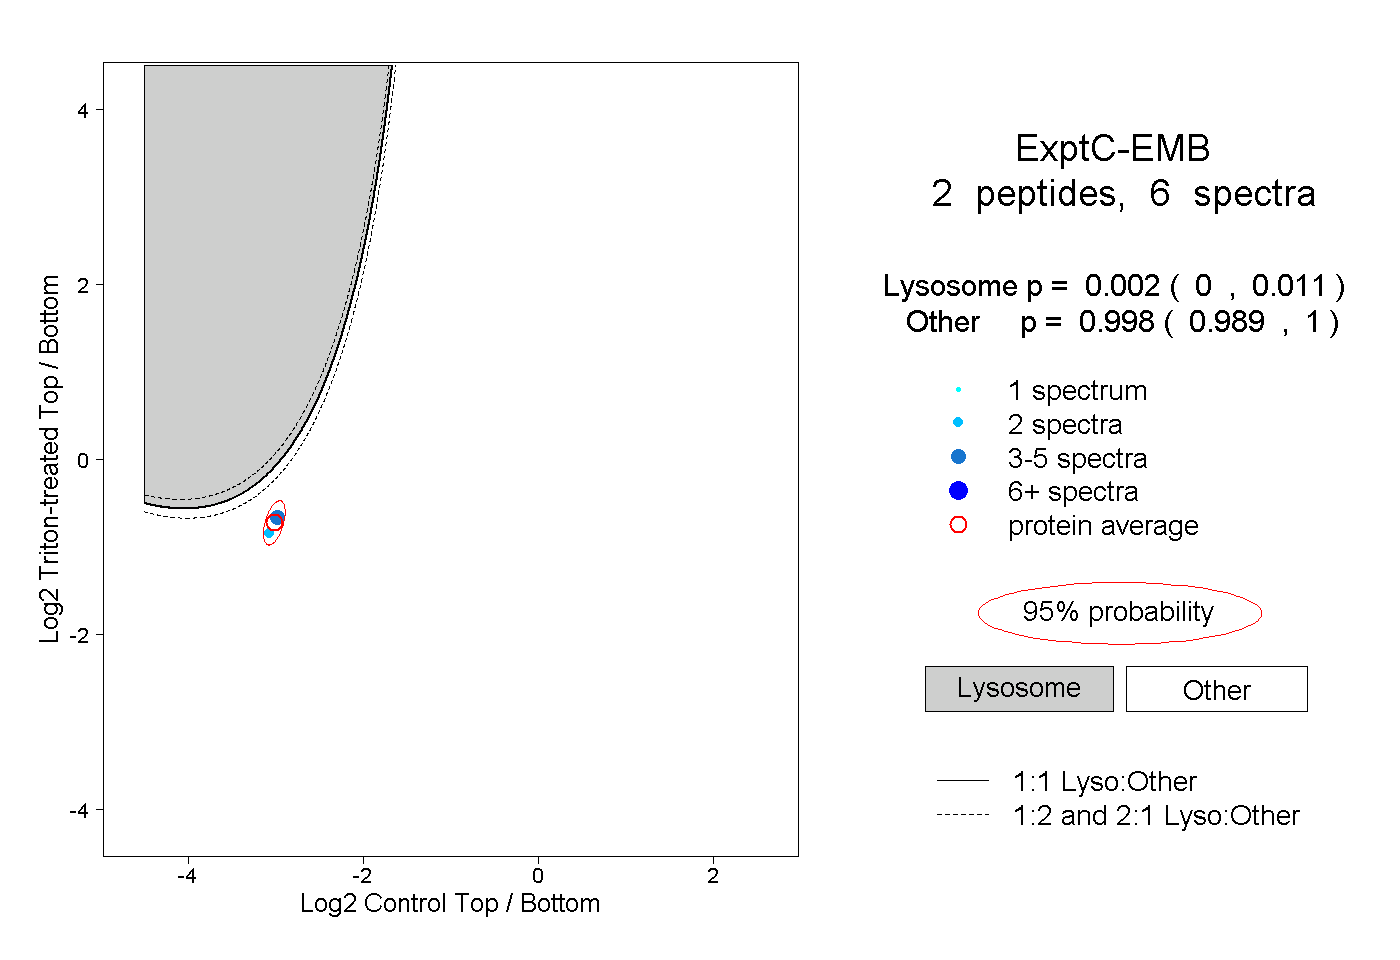
0.000 | 0.011
0.989 | 1.000
1peptide
spectrum
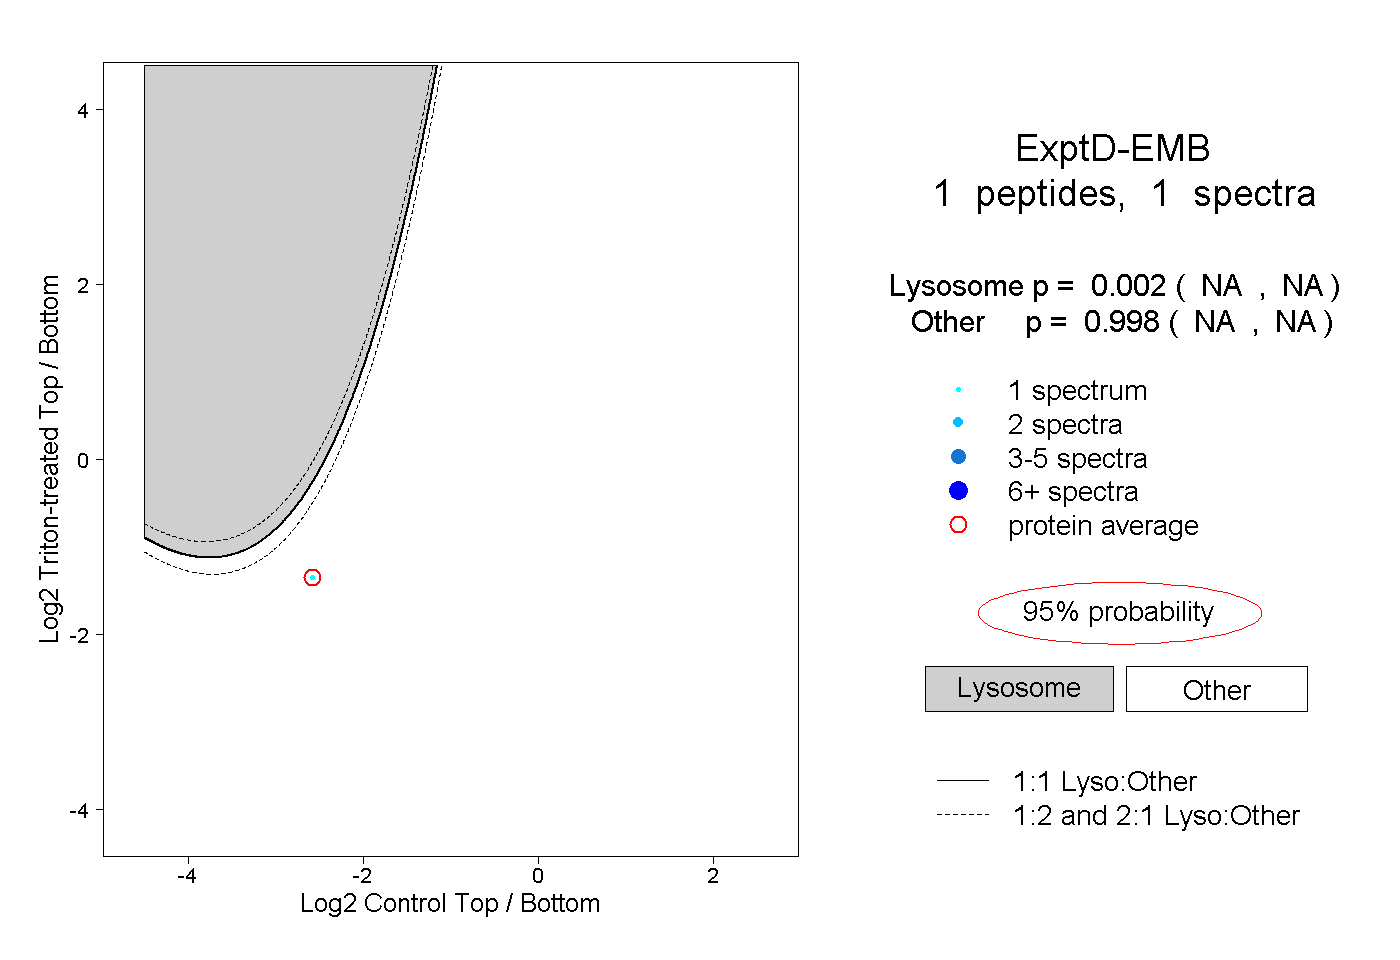
NA | NA
NA | NA