 3
3peptides
spectra
0.081 | 0.209
0.000 | 0.000
0.000 | 0.000
0.000 | 0.000
0.237 | 0.448
0.263 | 0.533
0.000 | 0.073
0.021 | 0.107
2peptides
spectra
0.000 | 0.011
0.989 | 1.000
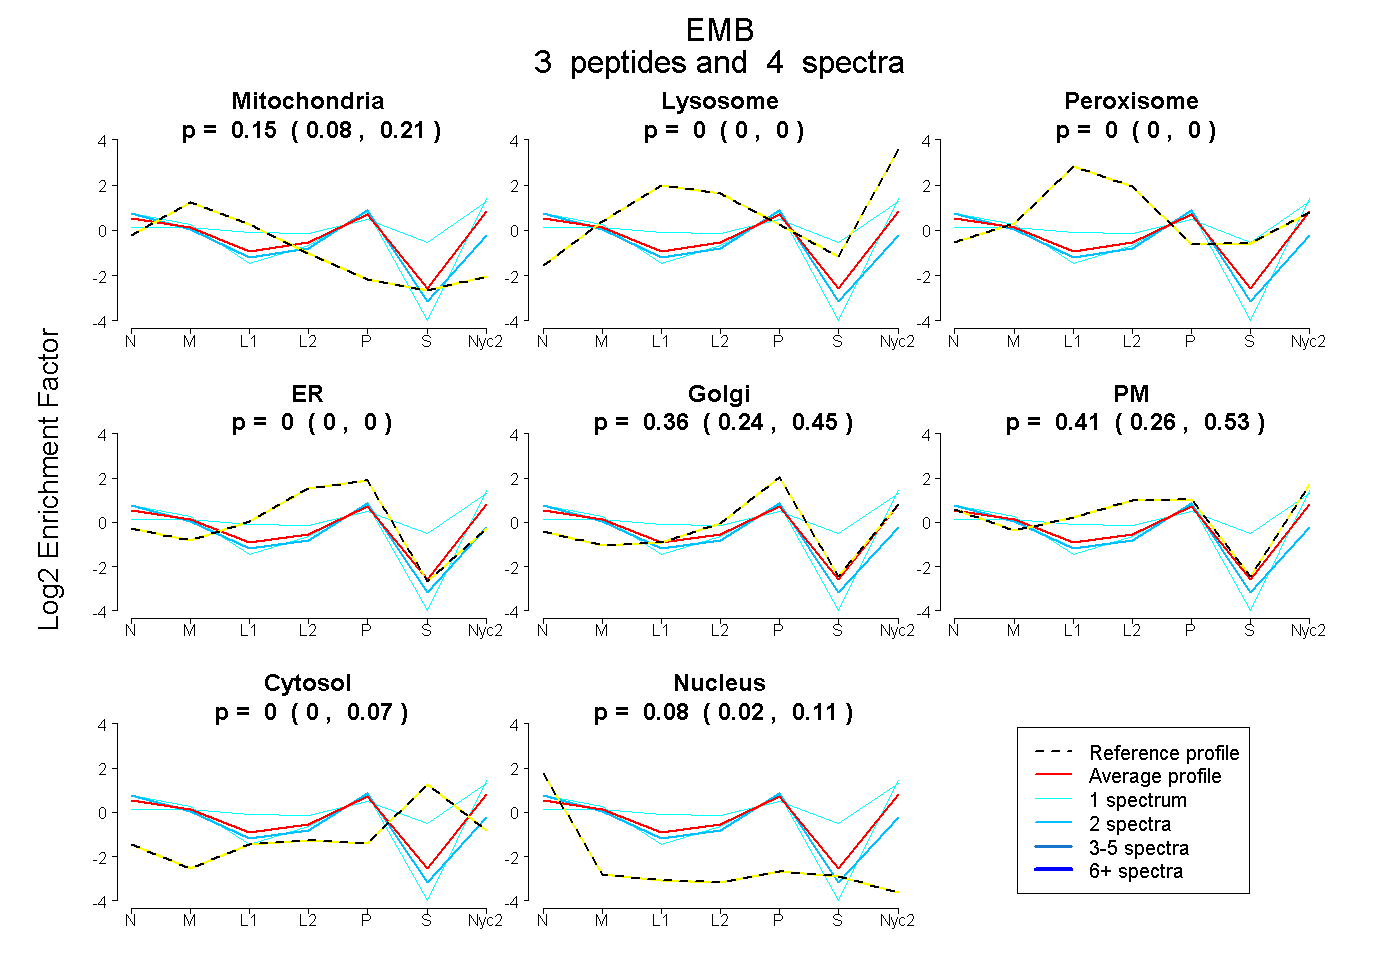
| Plot | Mito | Lyso | Perox | ER | Golgi | PM | Cytosol | Nucleus | |||||
| Expt A |
3 peptides |
4 spectra |
|
0.154 0.081 | 0.209 |
0.000 0.000 | 0.000 |
0.000 0.000 | 0.000 |
0.000 0.000 | 0.000 |
0.359 0.237 | 0.448 |
0.411 0.263 | 0.533 |
0.000 0.000 | 0.073 |
0.076 0.021 | 0.107 |
||
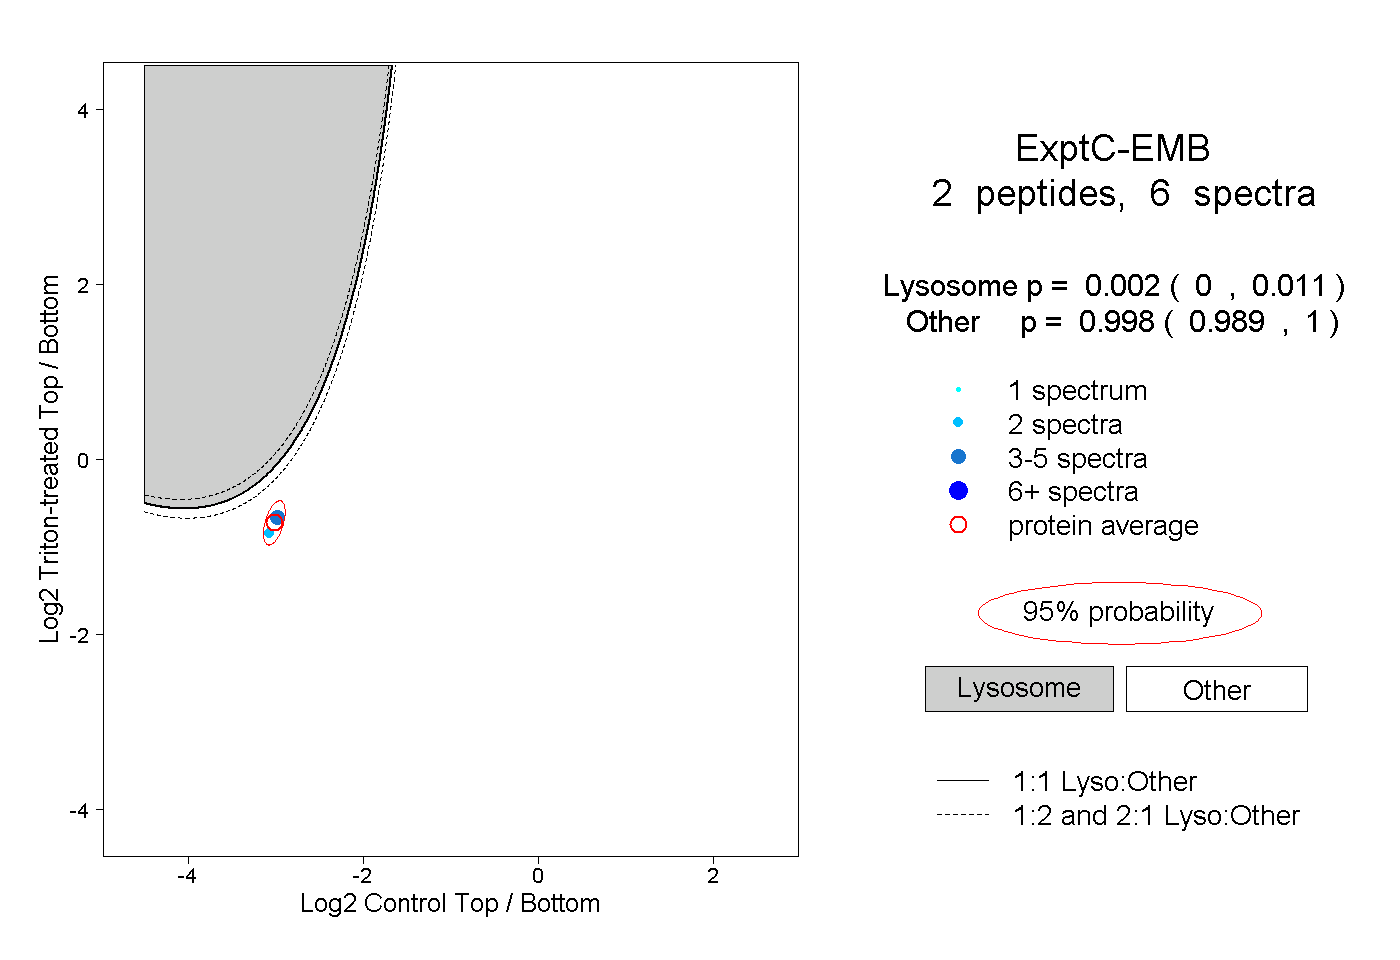
| Plot | Lyso | Other | |||||||||||
| Expt C |
2 peptides |
6 spectra |
|
0.002 0.000 | 0.011 |
0.998 0.989 | 1.000 |
| 2 spectra, GTFNIR | 0.001 | 0.999 | ||||||||
| 4 spectra, FTVFNSK | 0.003 | 0.997 |
| Plot | Lyso | Other | |||||||||||
| Expt D |
1 peptide |
1 spectrum |
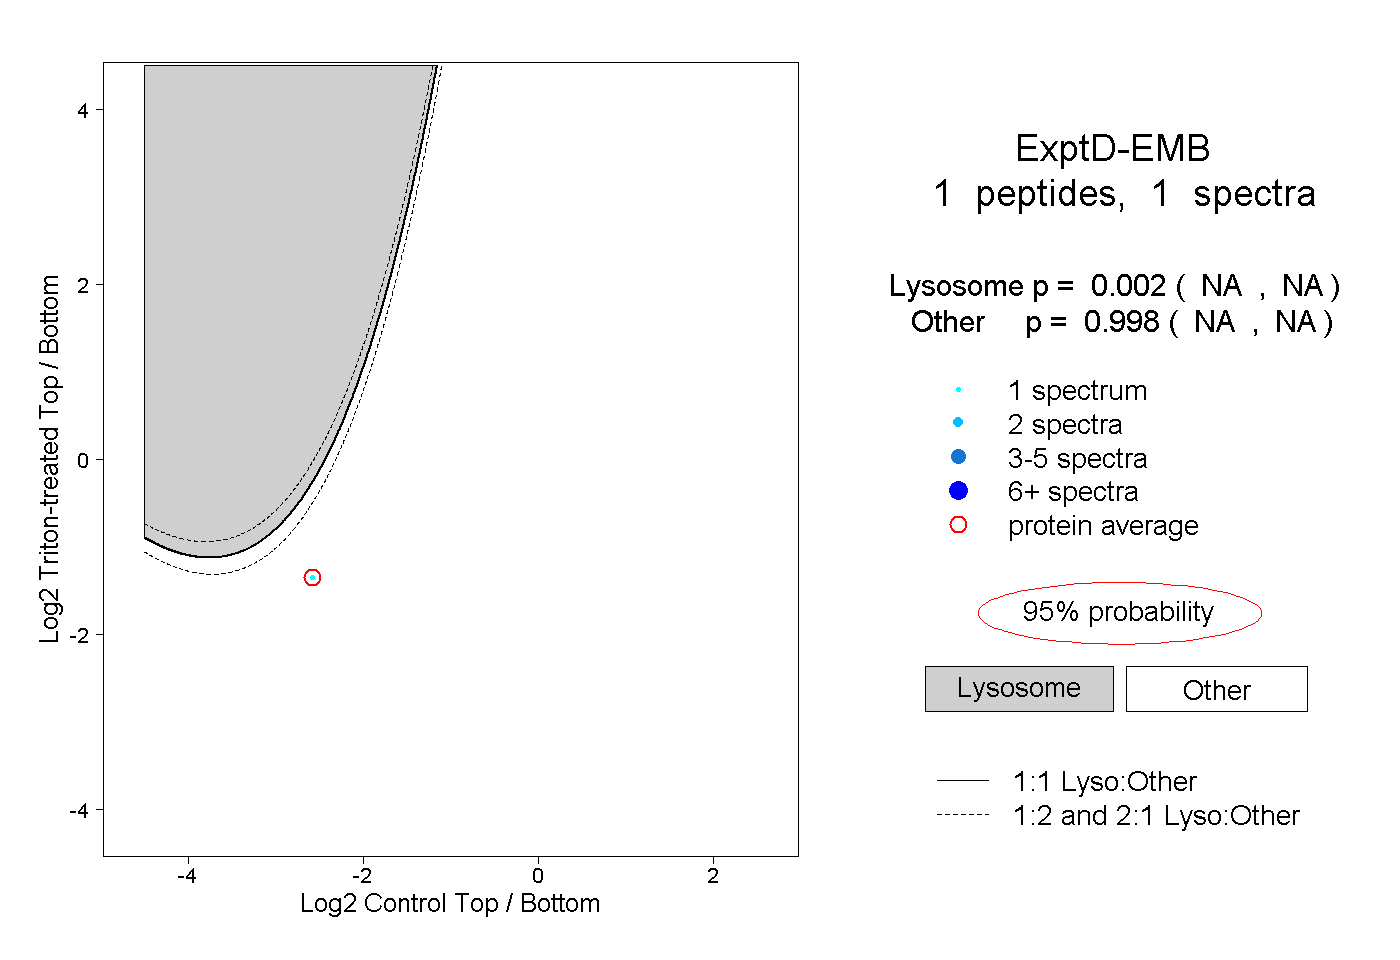 |
0.002 NA | NA |
0.998 NA | NA |