 5
5peptides
spectra
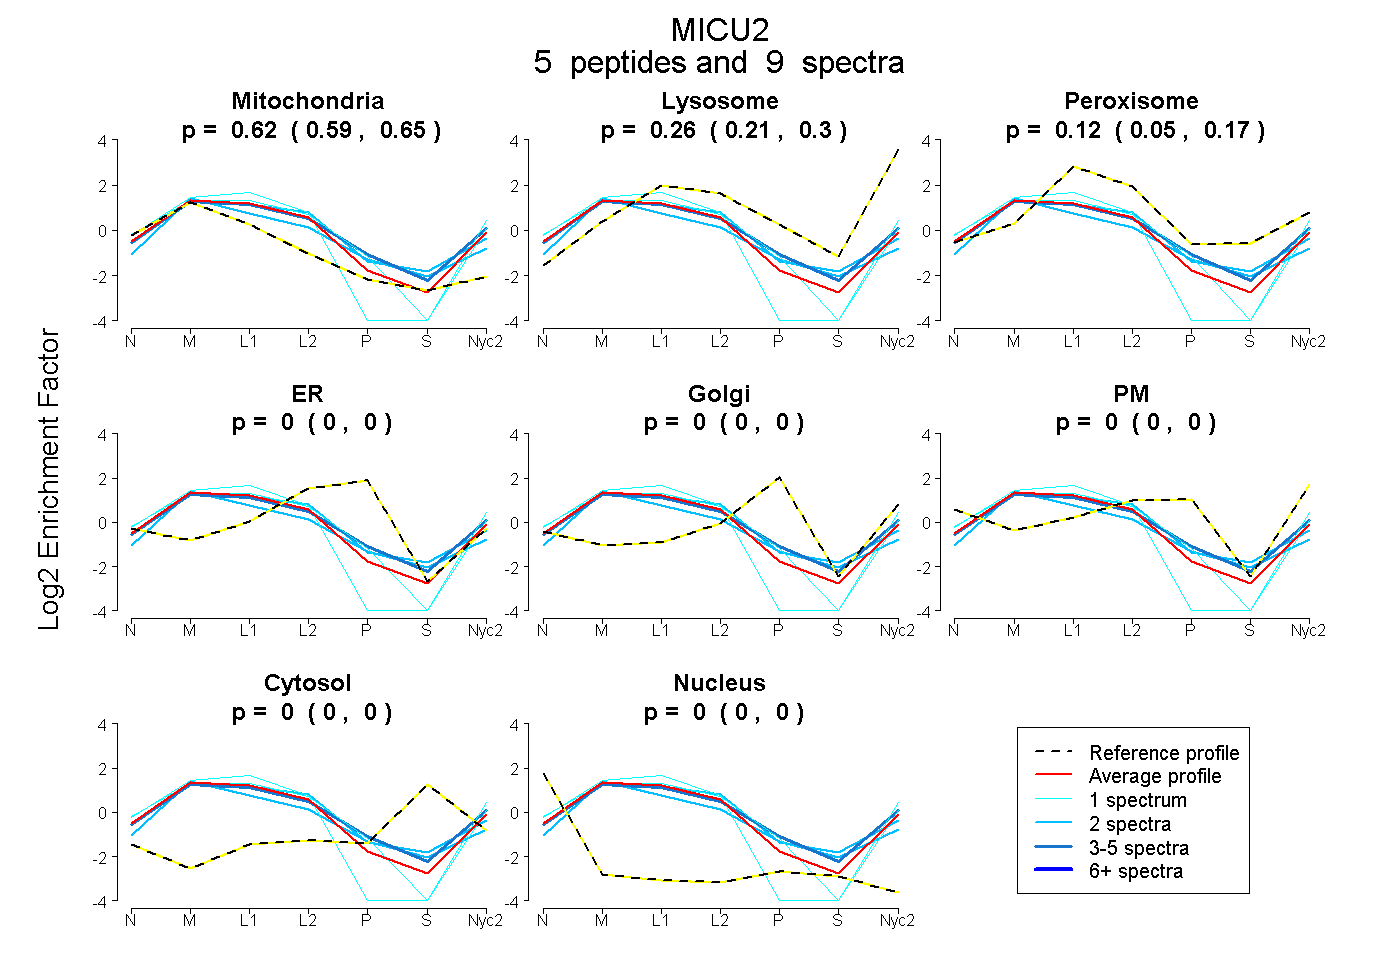
0.588 | 0.650
0.209 | 0.301
0.046 | 0.174
0.000 | 0.000
0.000 | 0.000
0.000 | 0.004
0.000 | 0.000
0.000 | 0.000
2peptides
spectra
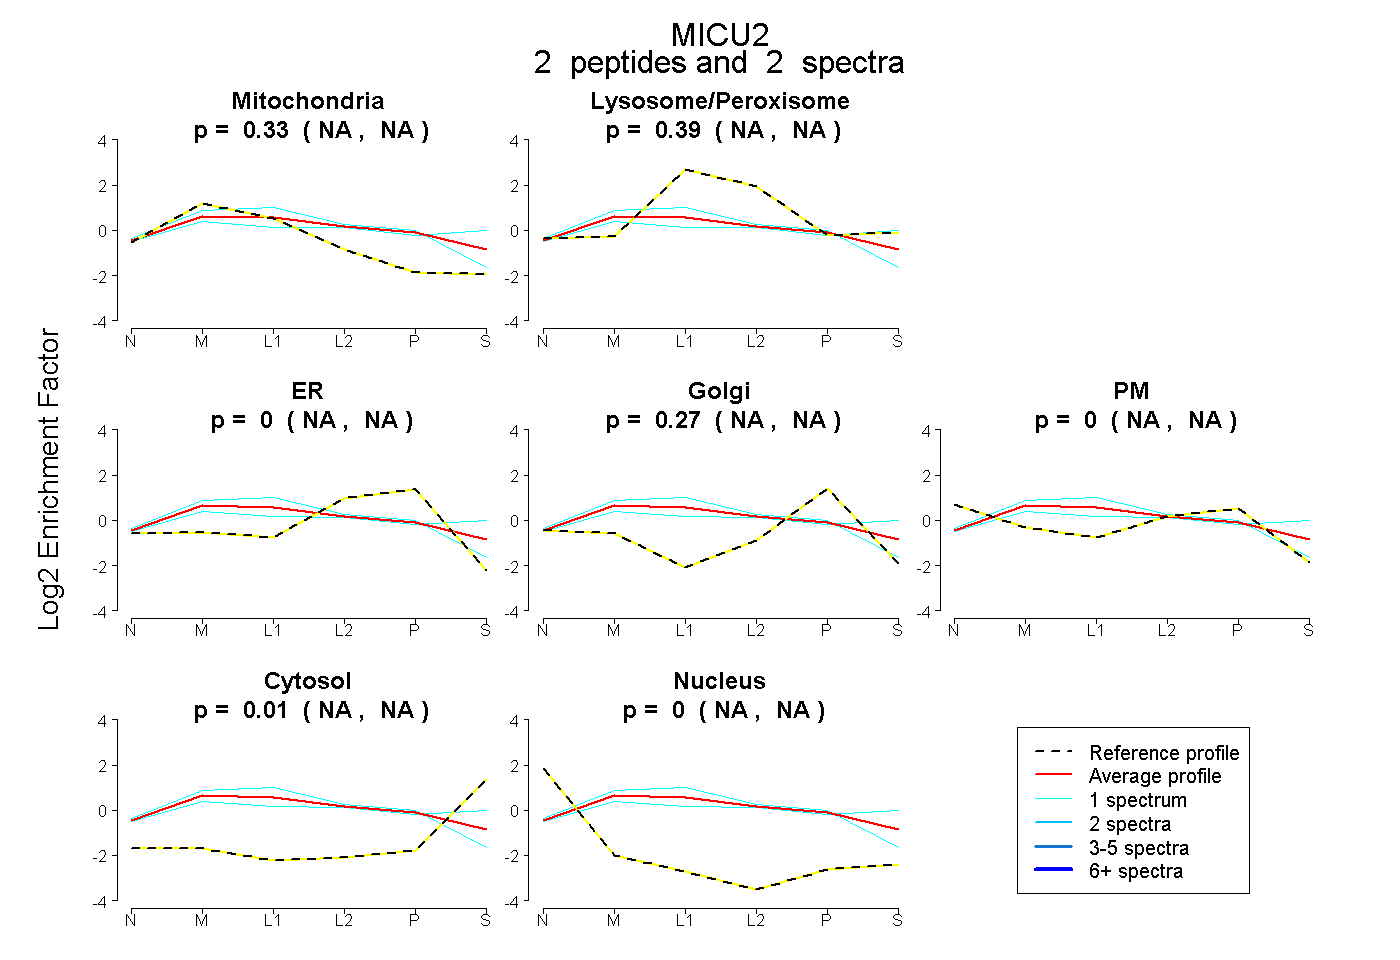
NA | NA
NA | NA
NA | NA
NA | NA
NA | NA
NA | NA
NA | NA
8peptides
spectra
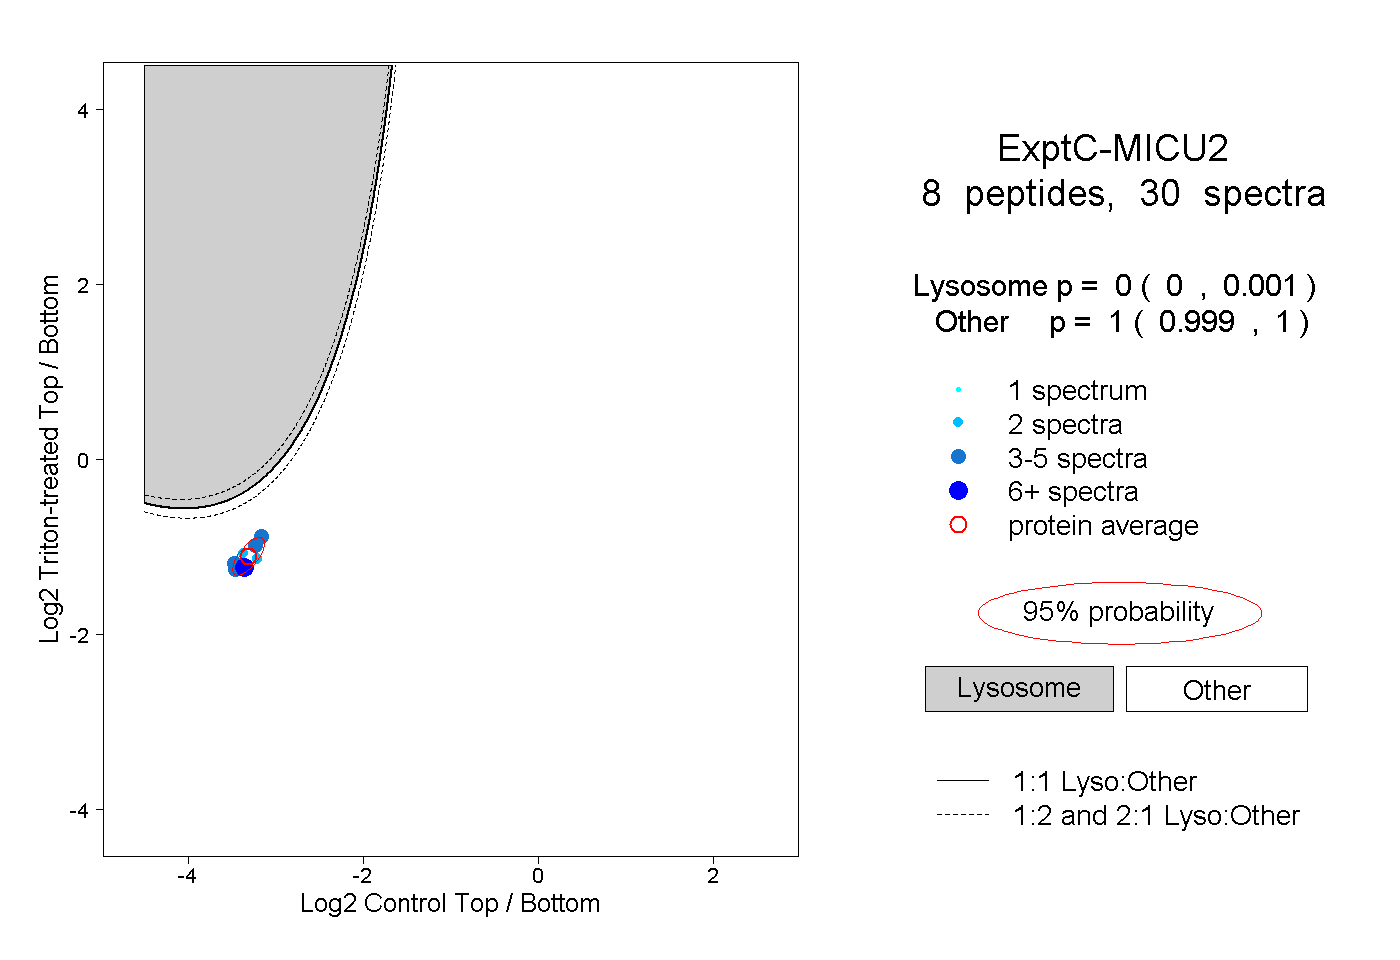
0.000 | 0.001
0.999 | 1.000
1peptide
spectra
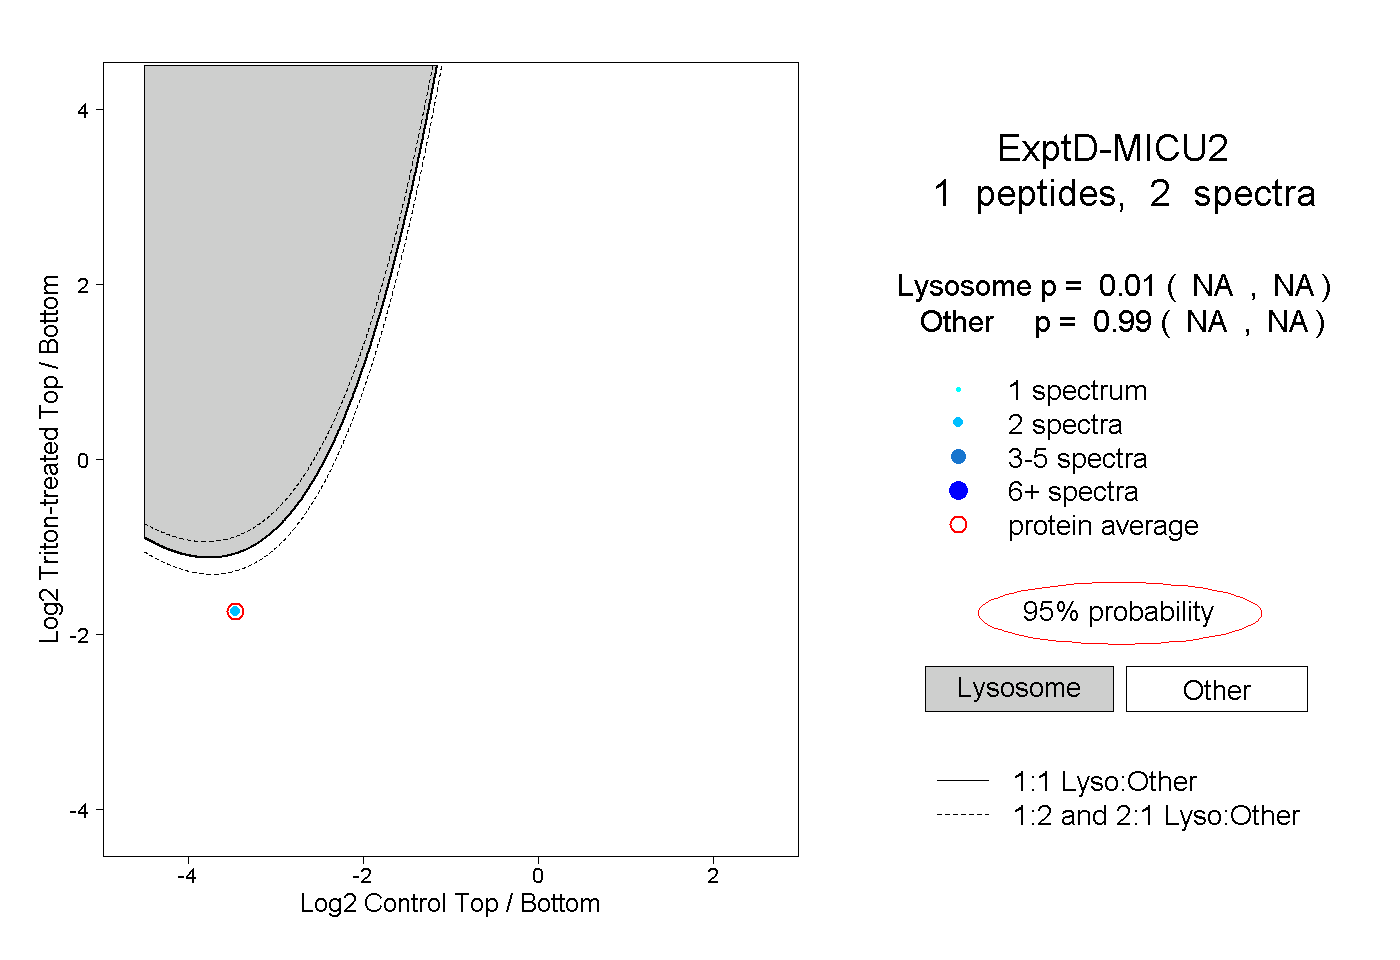
NA | NA
NA | NA