 5
5peptides
spectra
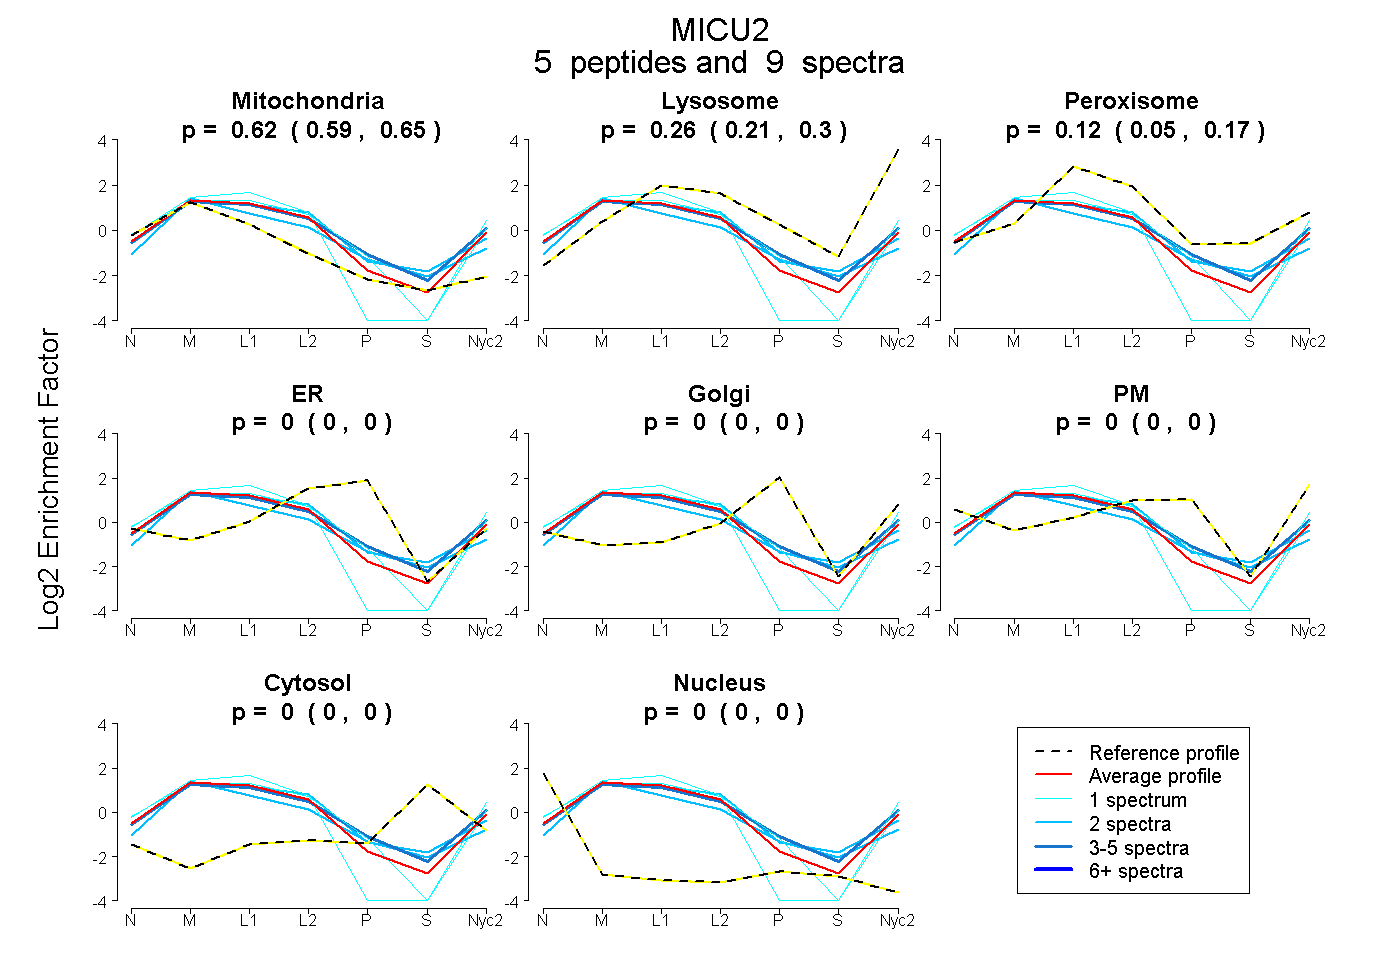
0.588 | 0.650
0.209 | 0.301
0.046 | 0.174
0.000 | 0.000
0.000 | 0.000
0.000 | 0.004
0.000 | 0.000
0.000 | 0.000
| Plot | Mito | Lyso | Perox | ER | Golgi | PM | Cytosol | Nucleus | |||||
| Expt A |
5 peptides |
9 spectra |
|
0.623 0.588 | 0.650 |
0.261 0.209 | 0.301 |
0.116 0.046 | 0.174 |
0.000 0.000 | 0.000 |
0.000 0.000 | 0.000 |
0.000 0.000 | 0.004 |
0.000 0.000 | 0.000 |
0.000 0.000 | 0.000 |
| 3 spectra, GLNFMR | 0.538 | 0.287 | 0.134 | 0.002 | 0.000 | 0.038 | 0.000 | 0.000 | ||
| 1 spectrum, MLDADGNEMIER | 0.531 | 0.247 | 0.000 | 0.000 | 0.000 | 0.222 | 0.000 | 0.000 | ||
| 1 spectrum, LSVGESISLDEFK | 0.736 | 0.182 | 0.082 | 0.000 | 0.000 | 0.000 | 0.000 | 0.000 | ||
| 2 spectra, DFLFSVMFER | 0.677 | 0.208 | 0.100 | 0.015 | 0.000 | 0.000 | 0.000 | 0.000 | ||
| 2 spectra, CGSTFFR | 0.521 | 0.134 | 0.346 | 0.000 | 0.000 | 0.000 | 0.000 | 0.000 |
| Plot | Mito | Lyso or Perox | ER | Golgi | PM | Cytosol | Nucleus | ||||||
| Expt B |
2 peptides |
2 spectra |
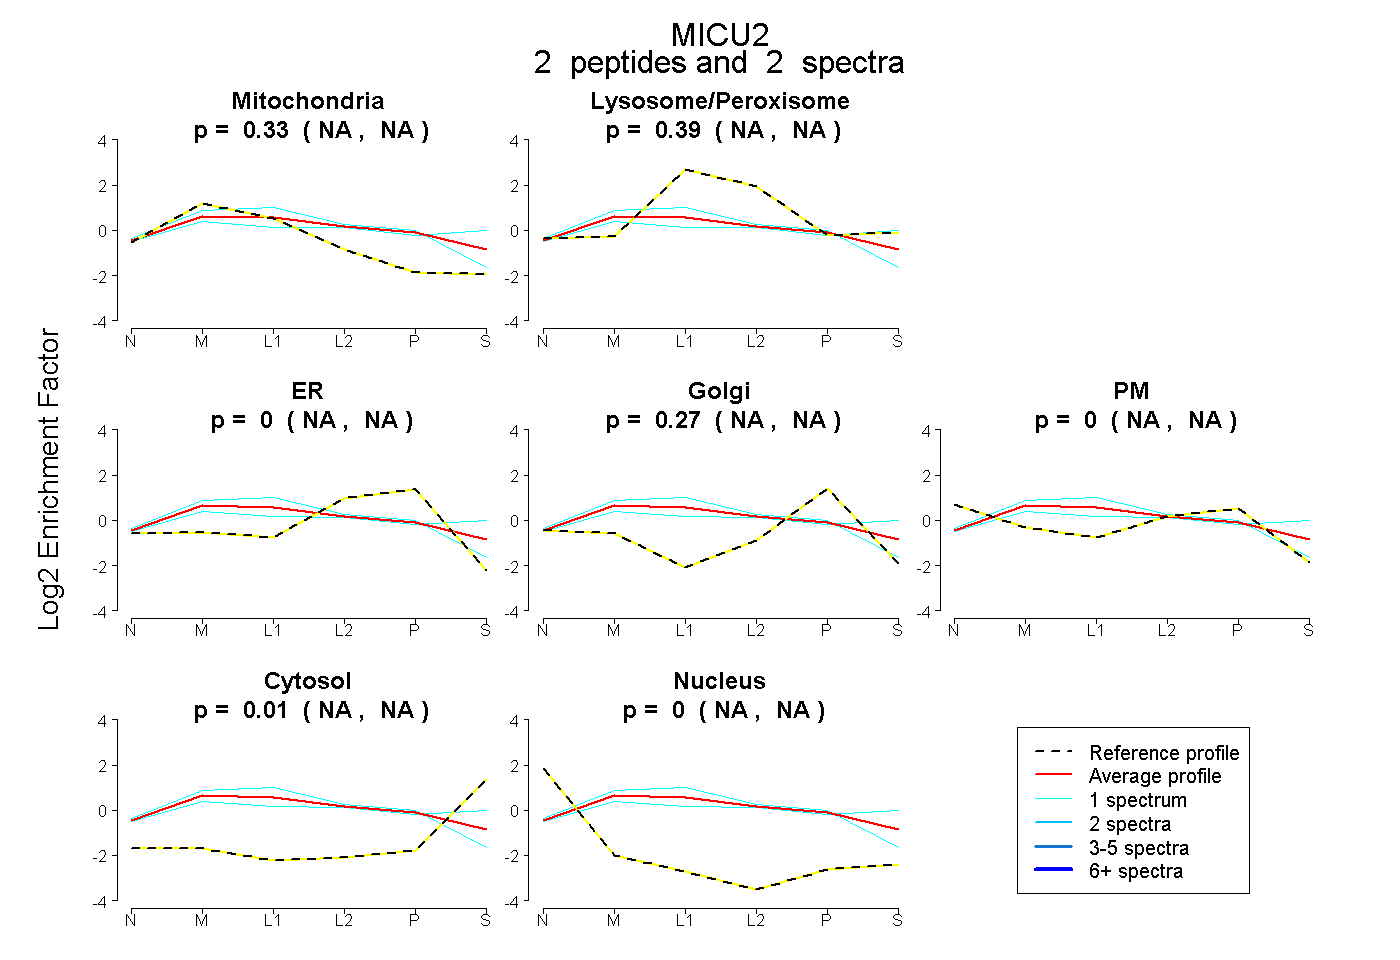 |
0.332 NA | NA |
0.389 NA | NA |
0.000 NA | NA |
0.274 NA | NA |
0.000 NA | NA |
0.005 NA | NA |
0.000 NA | NA |
|||
| Plot | Lyso | Other | |||||||||||
| Expt C |
8 peptides |
30 spectra |
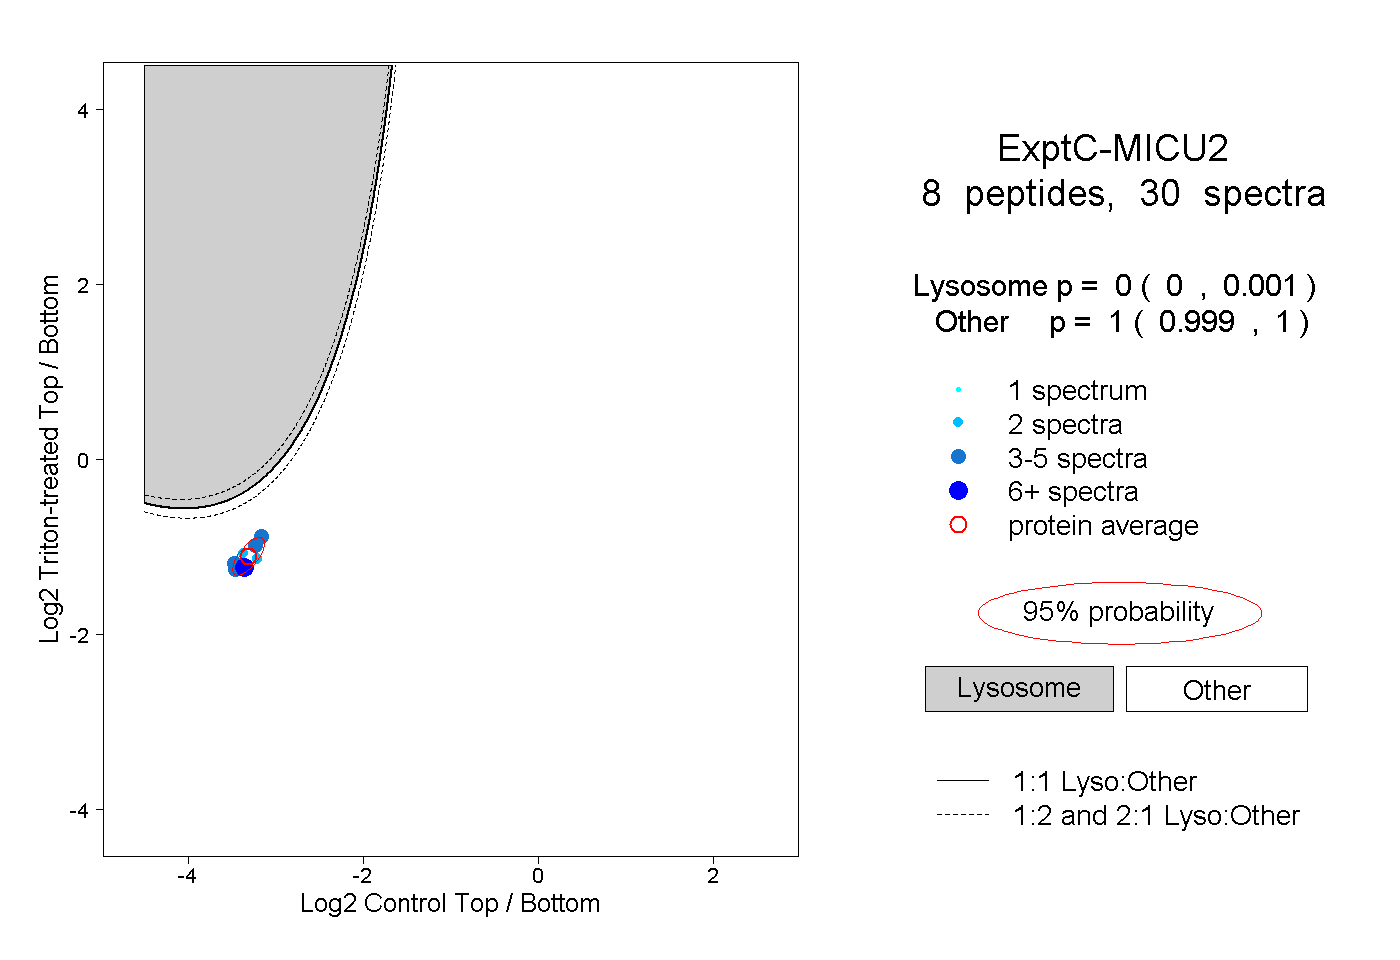 |
0.000 0.000 | 0.001 |
1.000 0.999 | 1.000 |
||||||||
| Plot | Lyso | Other | |||||||||||
| Expt D |
1 peptide |
2 spectra |
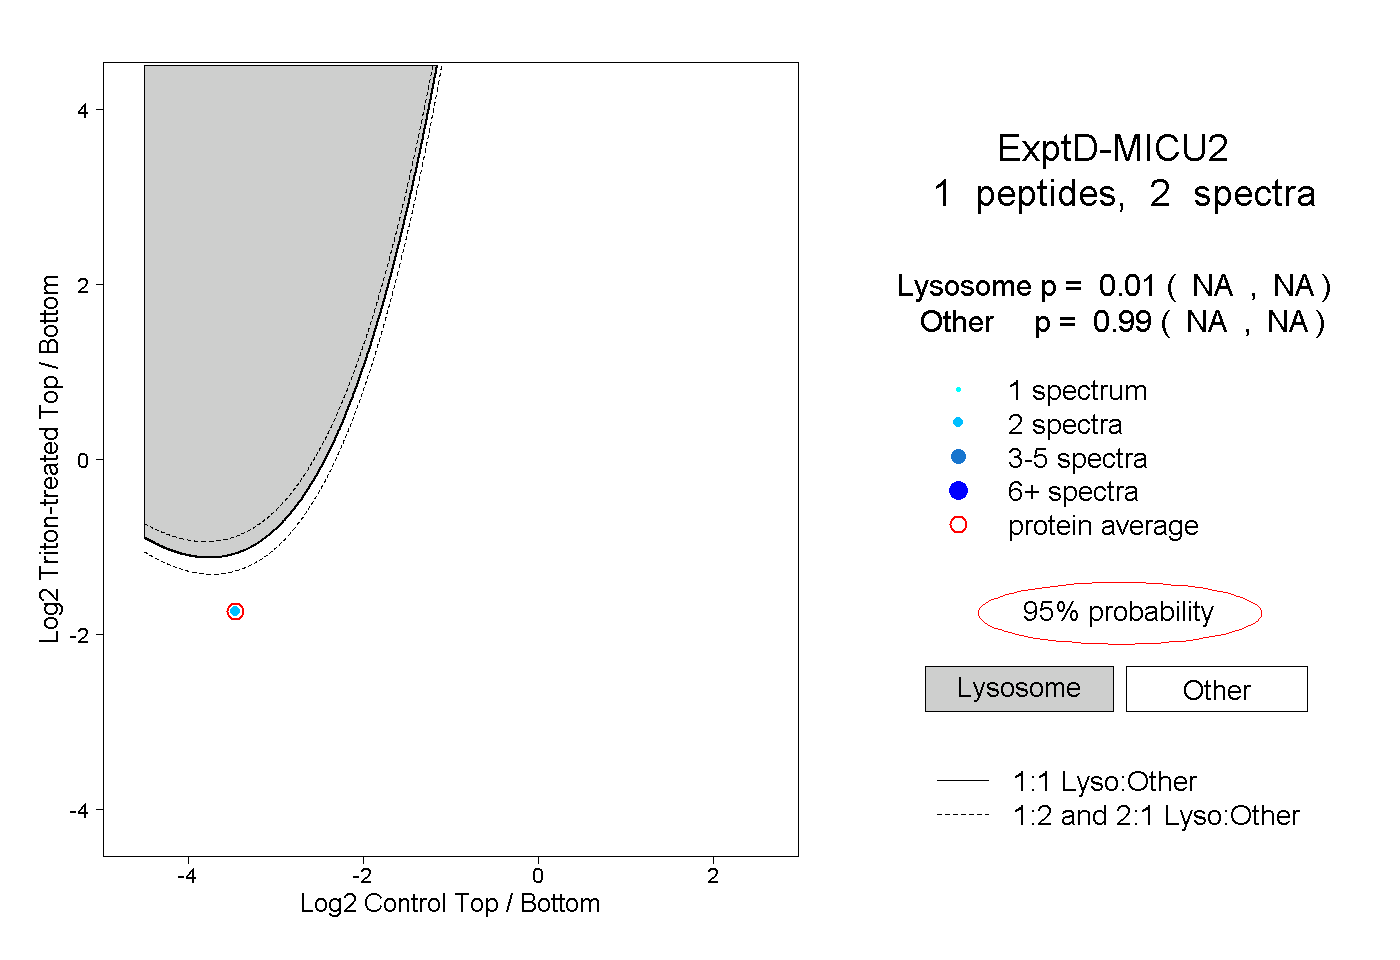 |
0.010 NA | NA |
0.990 NA | NA |