 21
21peptides
spectra
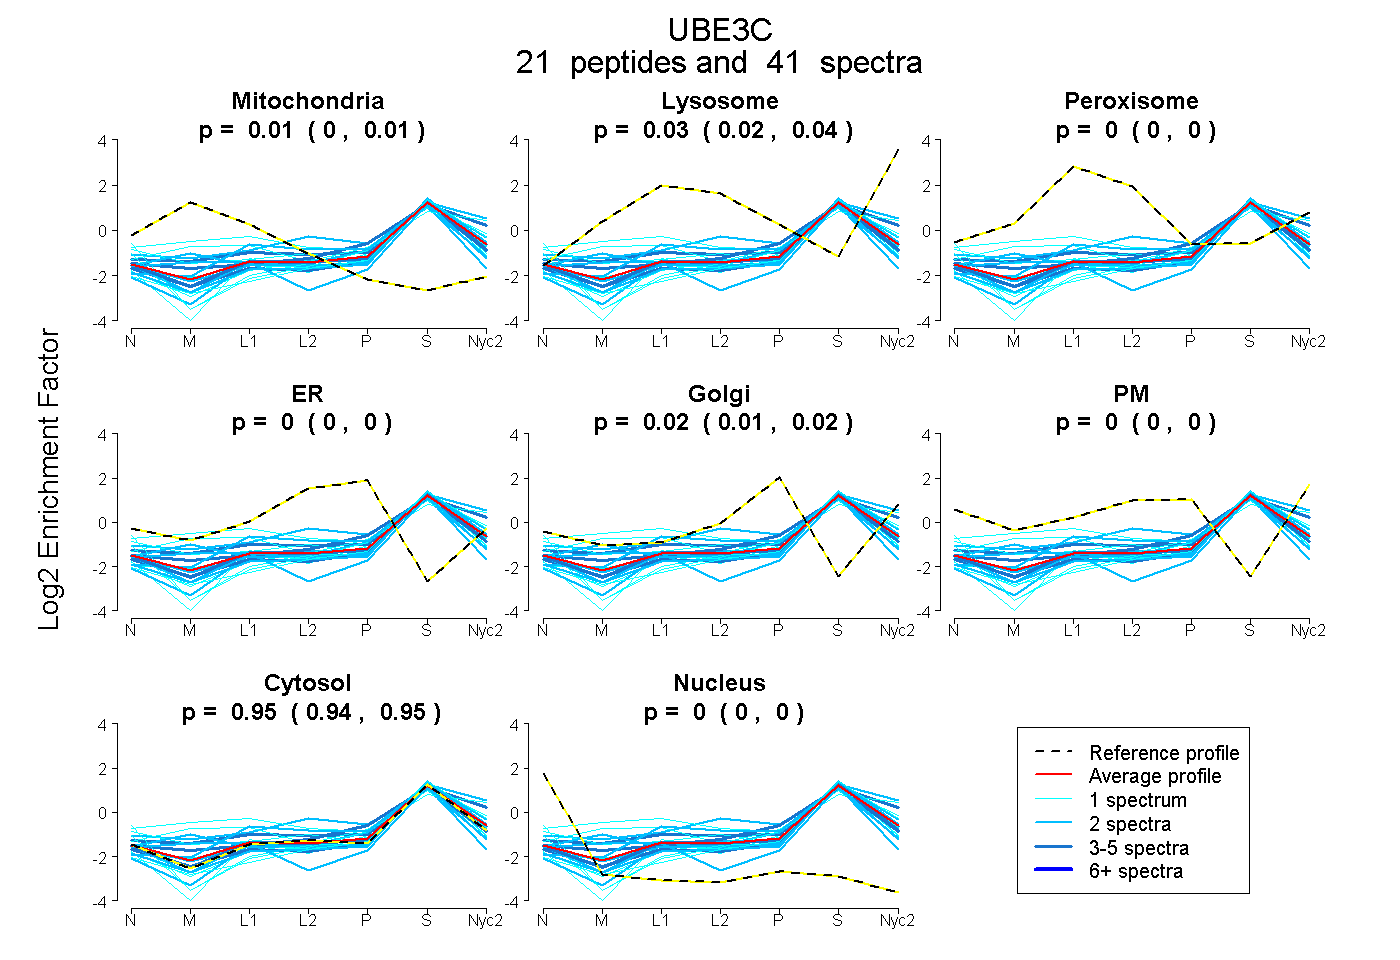
0.000 | 0.011
0.023 | 0.035
0.000 | 0.000
0.000 | 0.000
0.011 | 0.023
0.000 | 0.000
0.942 | 0.952
0.000 | 0.000
3peptides
spectra
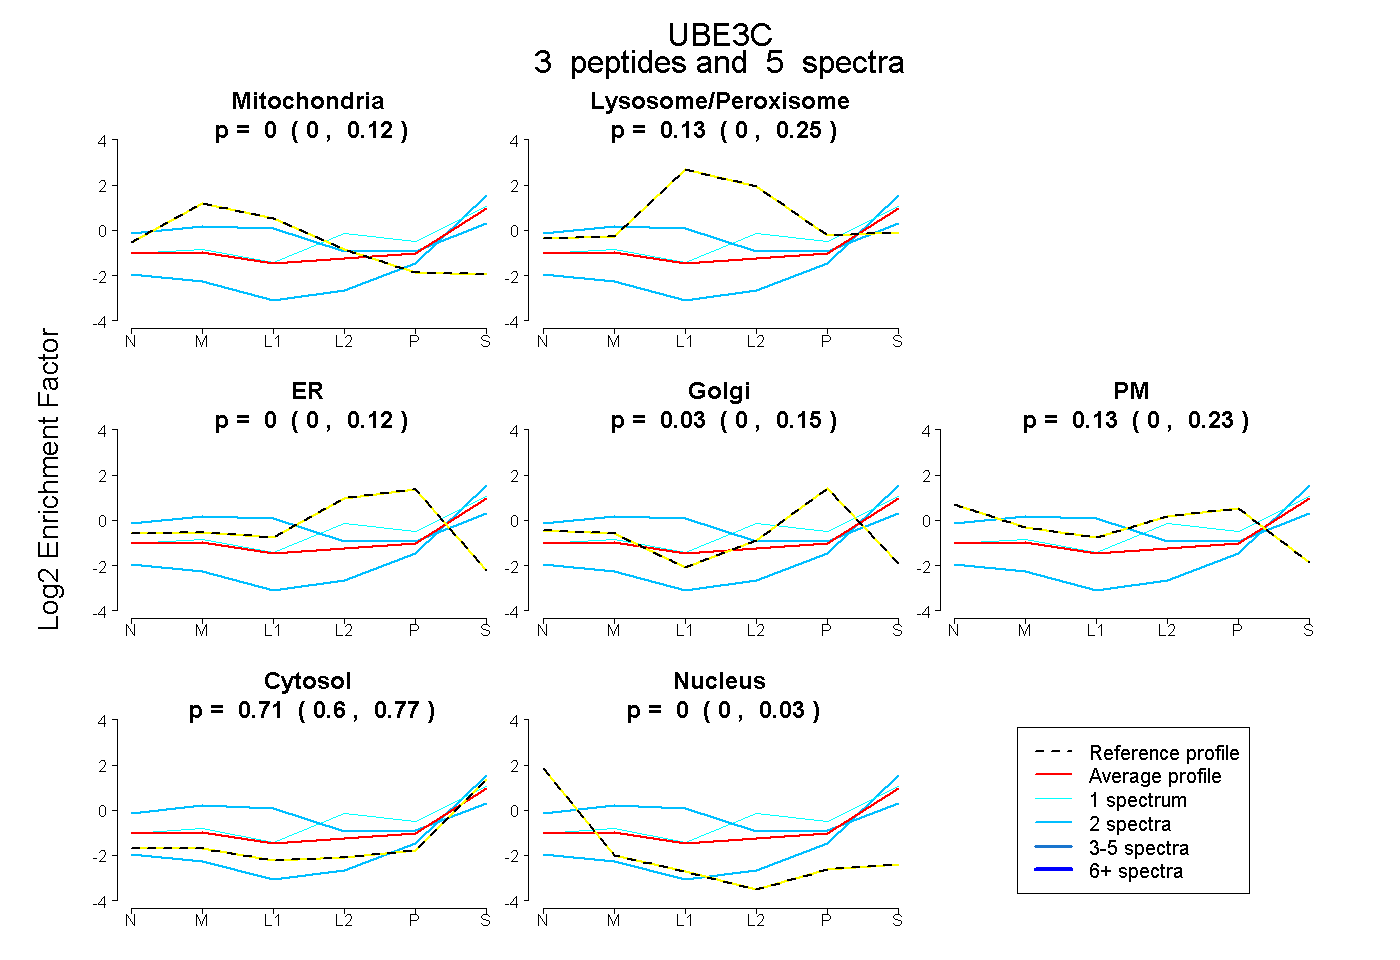
0.000 | 0.117
0.000 | 0.250
0.000 | 0.121
0.000 | 0.147
0.000 | 0.231
0.602 | 0.774
0.000 | 0.034
13peptides
spectra
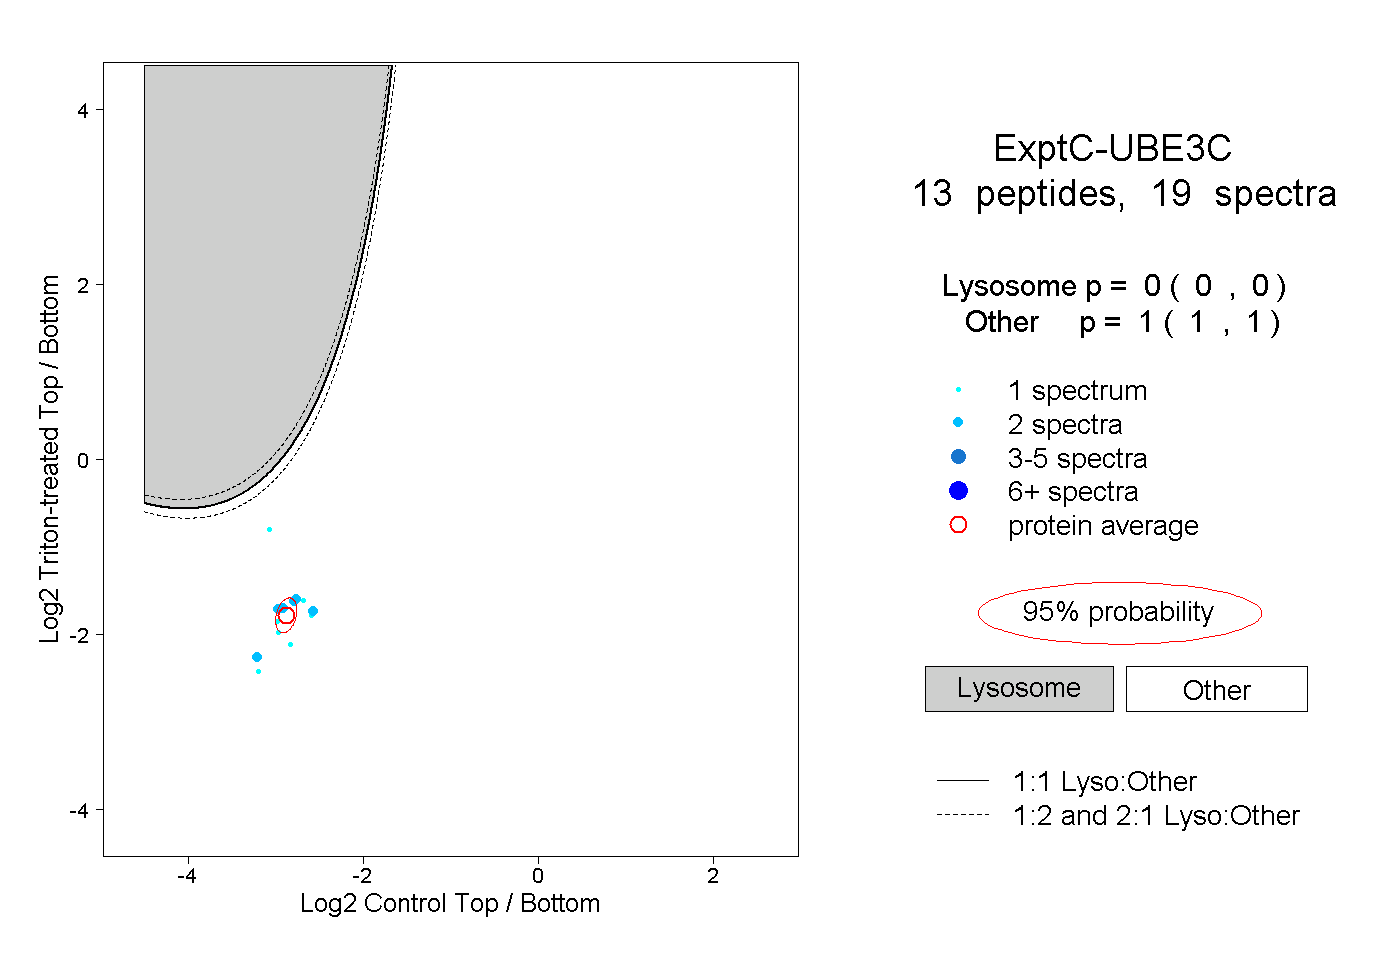
0.000 | 0.000
1.000 | 1.000