 21
21peptides
spectra
0.000 | 0.011
0.023 | 0.035
0.000 | 0.000
0.000 | 0.000
0.011 | 0.023
0.000 | 0.000
0.942 | 0.952
0.000 | 0.000
| Plot | Mito | Lyso | Perox | ER | Golgi | PM | Cytosol | Nucleus | |||||
| Expt A |
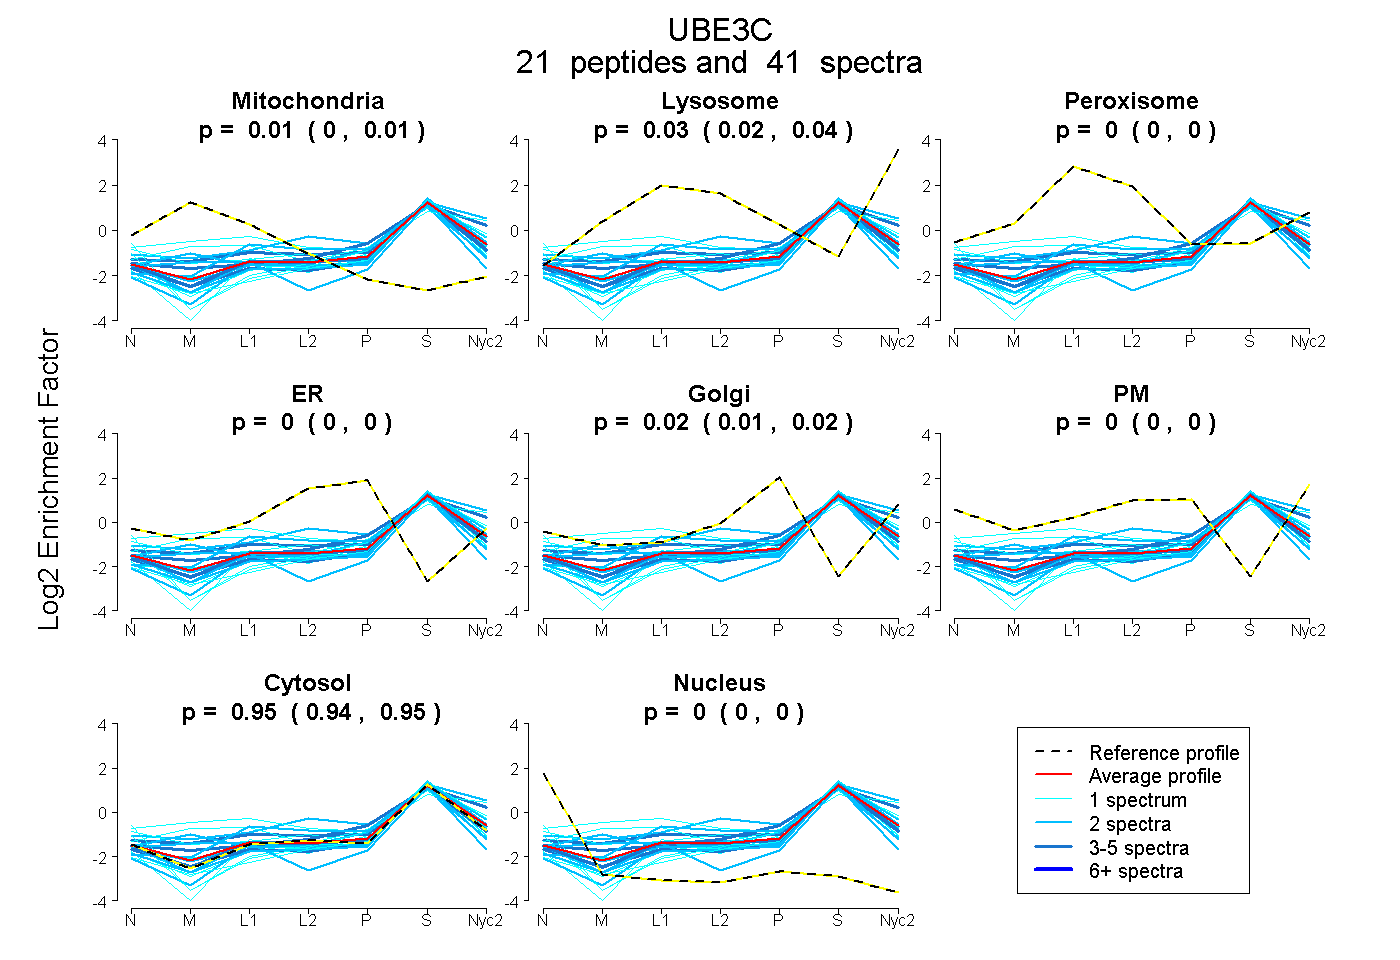
21 peptides |
41 spectra |
|
0.005 0.000 | 0.011 |
0.030 0.023 | 0.035 |
0.000 0.000 | 0.000 |
0.000 0.000 | 0.000 |
0.017 0.011 | 0.023 |
0.000 0.000 | 0.000 |
0.948 0.942 | 0.952 |
0.000 0.000 | 0.000 |
| 1 spectrum, QGLANVVSLEWLR | 0.117 | 0.259 | 0.044 | 0.000 | 0.000 | 0.000 | 0.580 | 0.000 | ||
| 2 spectra, LMSLCCR | 0.183 | 0.000 | 0.000 | 0.000 | 0.000 | 0.000 | 0.817 | 0.000 | ||
| 2 spectra, VTQLYVPASR | 0.000 | 0.000 | 0.000 | 0.000 | 0.000 | 0.000 | 1.000 | 0.000 | ||
| 2 spectra, SGFNPNQGFFK | 0.000 | 0.221 | 0.000 | 0.000 | 0.000 | 0.000 | 0.779 | 0.000 | ||
| 2 spectra, LPSSIEYSDLSR | 0.000 | 0.000 | 0.000 | 0.000 | 0.000 | 0.000 | 1.000 | 0.000 | ||
| 1 spectrum, ASLLHR | 0.000 | 0.000 | 0.000 | 0.000 | 0.000 | 0.000 | 1.000 | 0.000 | ||
| 4 spectra, LAYPETKPEVR | 0.022 | 0.000 | 0.000 | 0.000 | 0.117 | 0.000 | 0.860 | 0.000 | ||
| 1 spectrum, DIPVTGANR | 0.000 | 0.000 | 0.000 | 0.000 | 0.000 | 0.000 | 1.000 | 0.000 | ||
| 2 spectra, IADGPALTLLVR | 0.000 | 0.047 | 0.000 | 0.000 | 0.000 | 0.000 | 0.953 | 0.000 | ||
| 1 spectrum, GSPMSFEDSSR | 0.063 | 0.094 | 0.000 | 0.000 | 0.000 | 0.027 | 0.815 | 0.000 | ||
| 1 spectrum, WVQLFK | 0.000 | 0.000 | 0.000 | 0.000 | 0.000 | 0.000 | 1.000 | 0.000 | ||
| 1 spectrum, QLLFFYK | 0.000 | 0.000 | 0.000 | 0.000 | 0.010 | 0.000 | 0.899 | 0.091 | ||
| 3 spectra, VSAPYITEECLR | 0.000 | 0.000 | 0.000 | 0.000 | 0.003 | 0.000 | 0.997 | 0.000 | ||
| 2 spectra, DSASEEVFTR | 0.000 | 0.000 | 0.000 | 0.000 | 0.000 | 0.000 | 1.000 | 0.000 | ||
| 4 spectra, EFLNELLK | 0.010 | 0.193 | 0.000 | 0.000 | 0.000 | 0.000 | 0.797 | 0.000 | ||
| 1 spectrum, IAYIHLVADYR | 0.187 | 0.060 | 0.042 | 0.000 | 0.000 | 0.000 | 0.712 | 0.000 | ||
| 1 spectrum, NIFLLK | 0.000 | 0.000 | 0.000 | 0.000 | 0.000 | 0.000 | 0.959 | 0.041 | ||
| 5 spectra, HYYFLGR | 0.000 | 0.000 | 0.000 | 0.000 | 0.000 | 0.000 | 1.000 | 0.000 | ||
| 1 spectrum, FVTSCSRPPLLGFK | 0.026 | 0.000 | 0.000 | 0.000 | 0.000 | 0.000 | 0.974 | 0.000 | ||
| 2 spectra, VVEGFTDEEK | 0.118 | 0.000 | 0.000 | 0.000 | 0.000 | 0.000 | 0.855 | 0.028 | ||
| 2 spectra, DACLGIIK | 0.042 | 0.000 | 0.115 | 0.126 | 0.000 | 0.000 | 0.717 | 0.000 |
| Plot | Mito | Lyso or Perox | ER | Golgi | PM | Cytosol | Nucleus | ||||||
| Expt B |
3 peptides |
5 spectra |
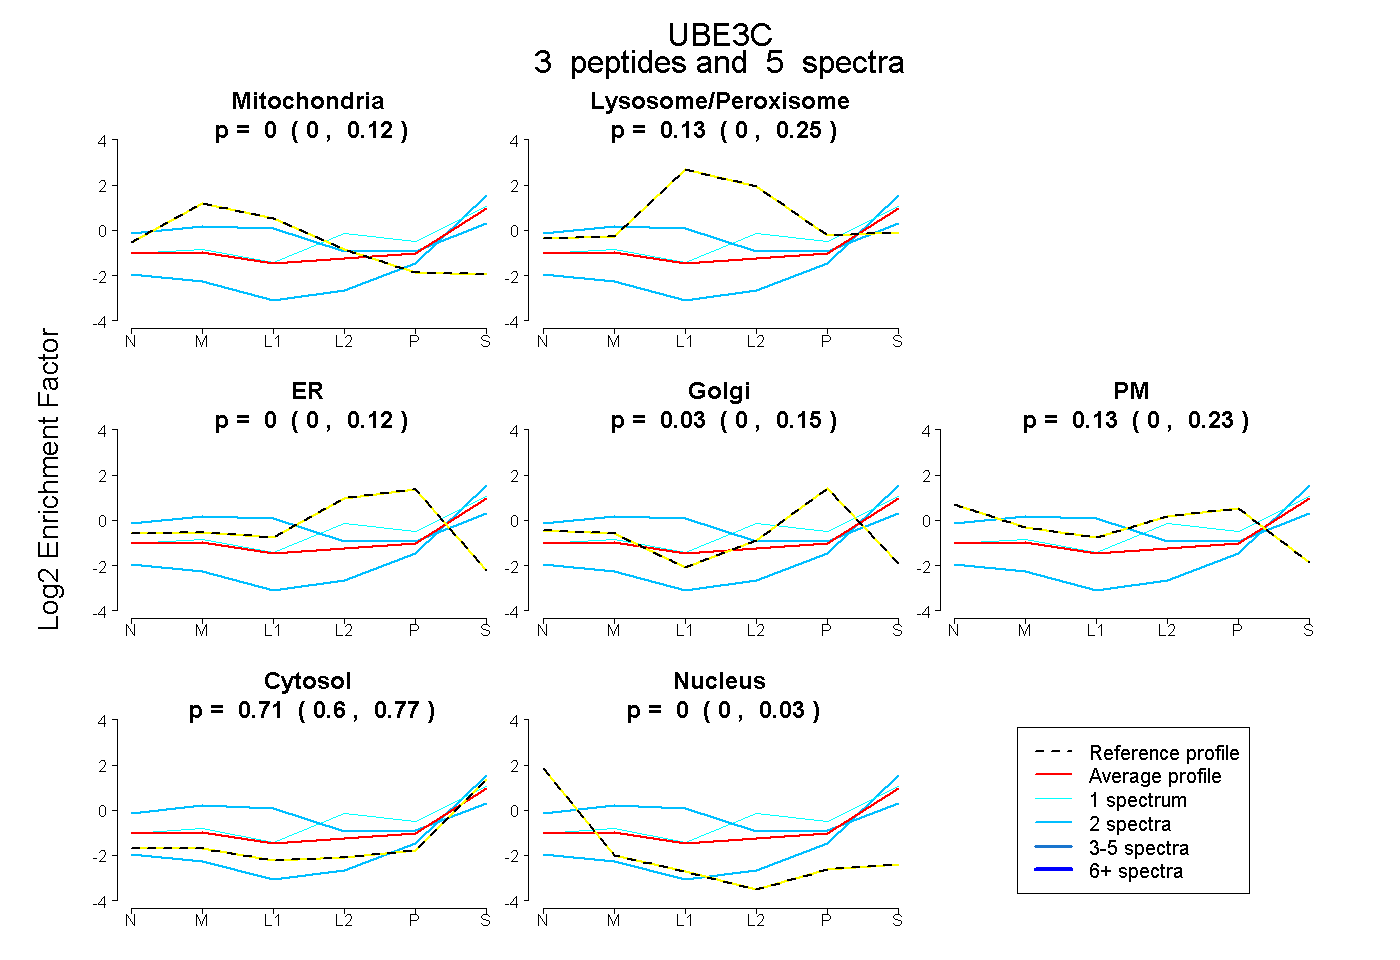 |
0.000 0.000 | 0.117 |
0.129 0.000 | 0.250 |
0.000 0.000 | 0.121 |
0.031 0.000 | 0.147 |
0.130 0.000 | 0.231 |
0.711 0.602 | 0.774 |
0.000 0.000 | 0.034 |
|||
| Plot | Lyso | Other | |||||||||||
| Expt C |
13 peptides |
19 spectra |
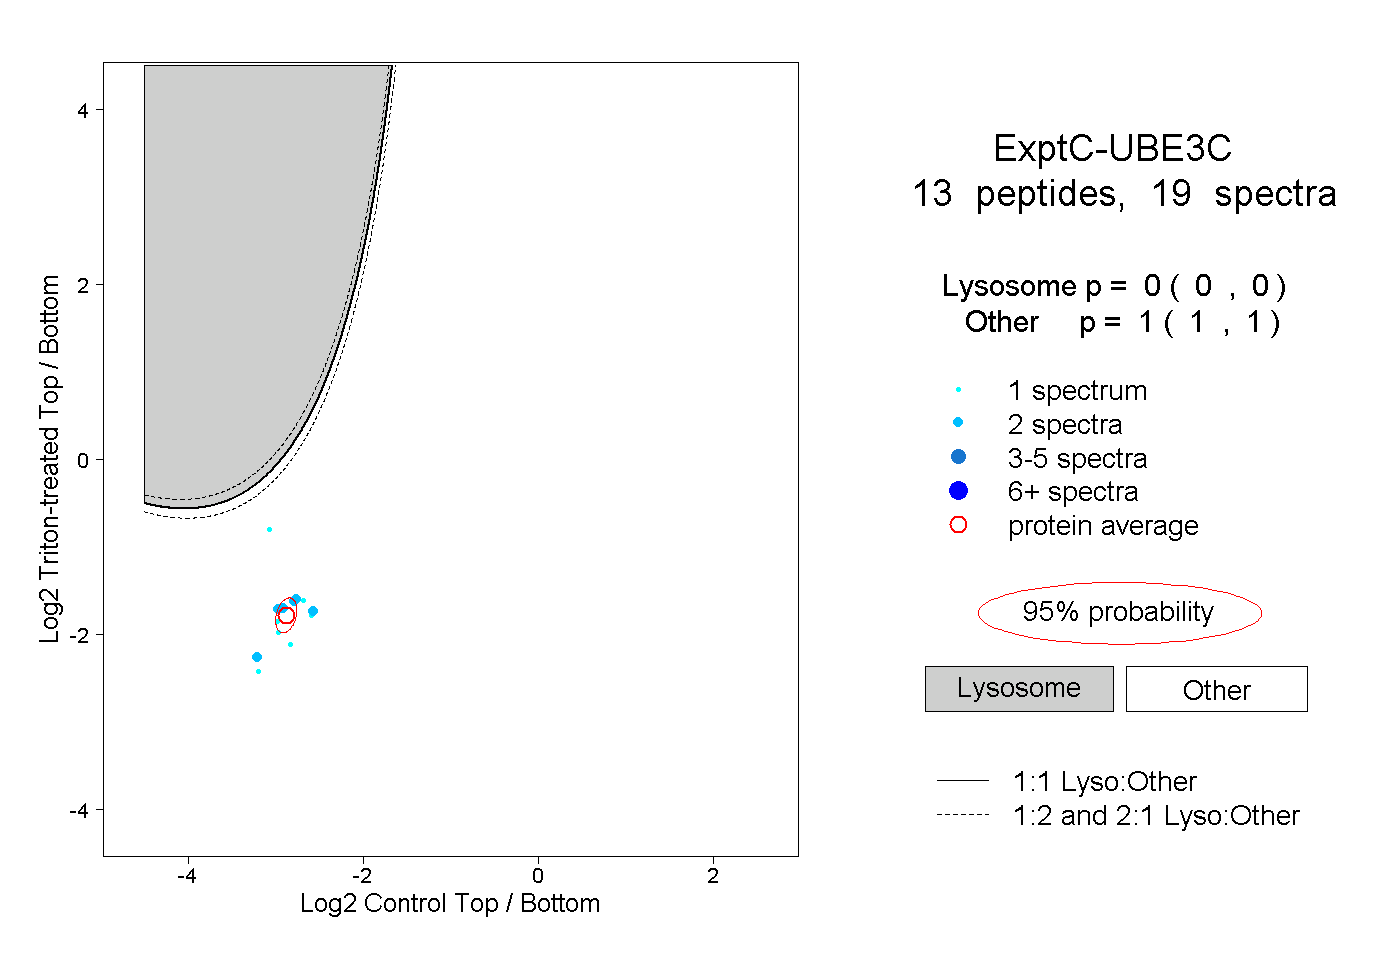 |
0.000 0.000 | 0.000 |
1.000 1.000 | 1.000 |