 7
7peptides
spectra
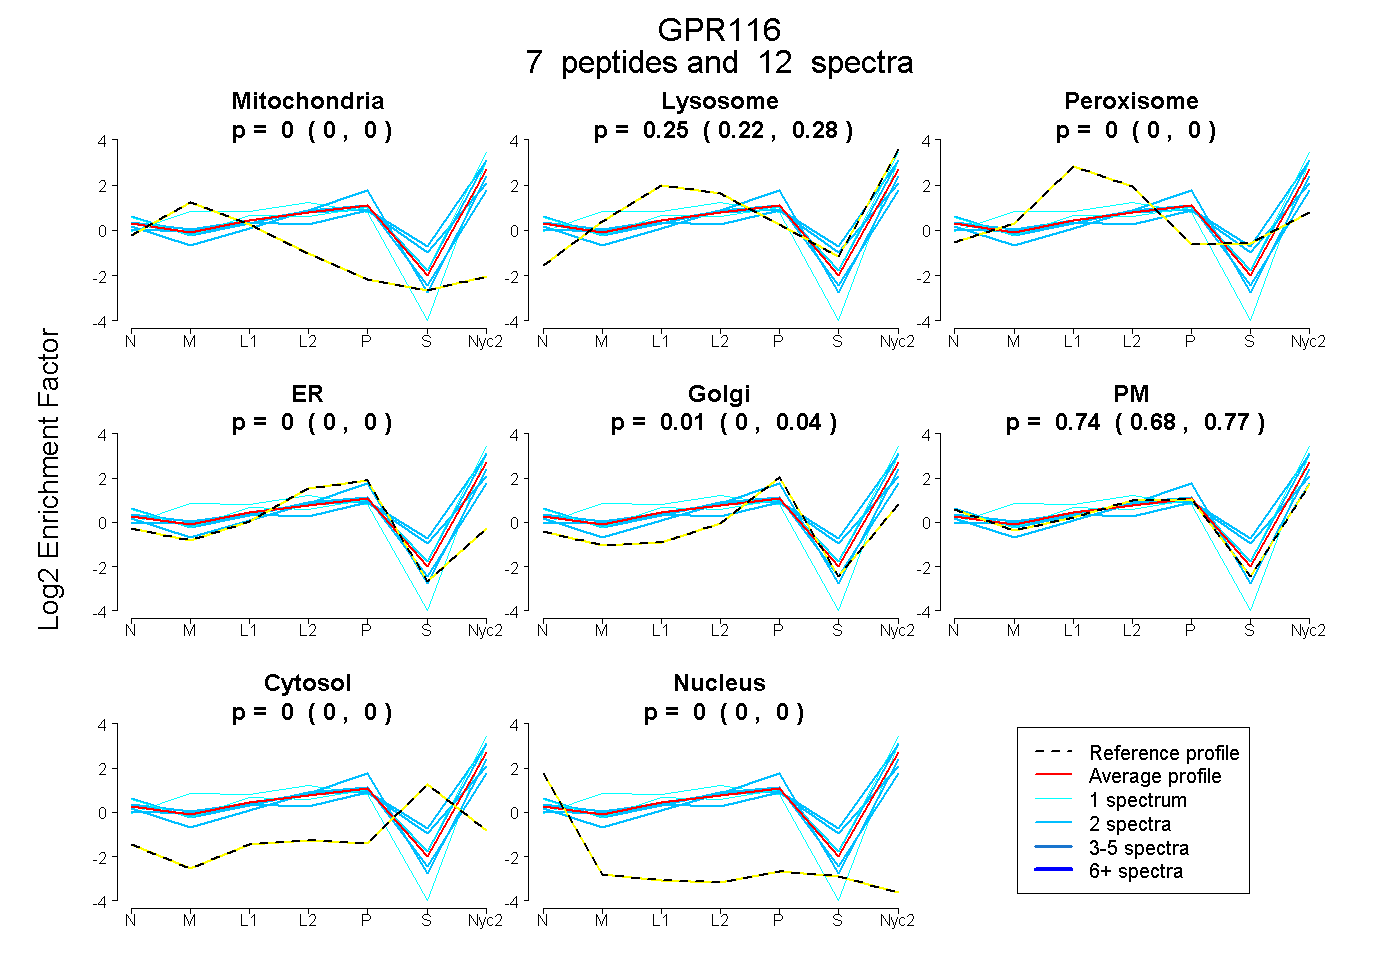
0.000 | 0.000
0.217 | 0.275
0.000 | 0.000
0.000 | 0.000
0.000 | 0.041
0.685 | 0.774
0.000 | 0.000
0.000 | 0.000
12peptides
spectra
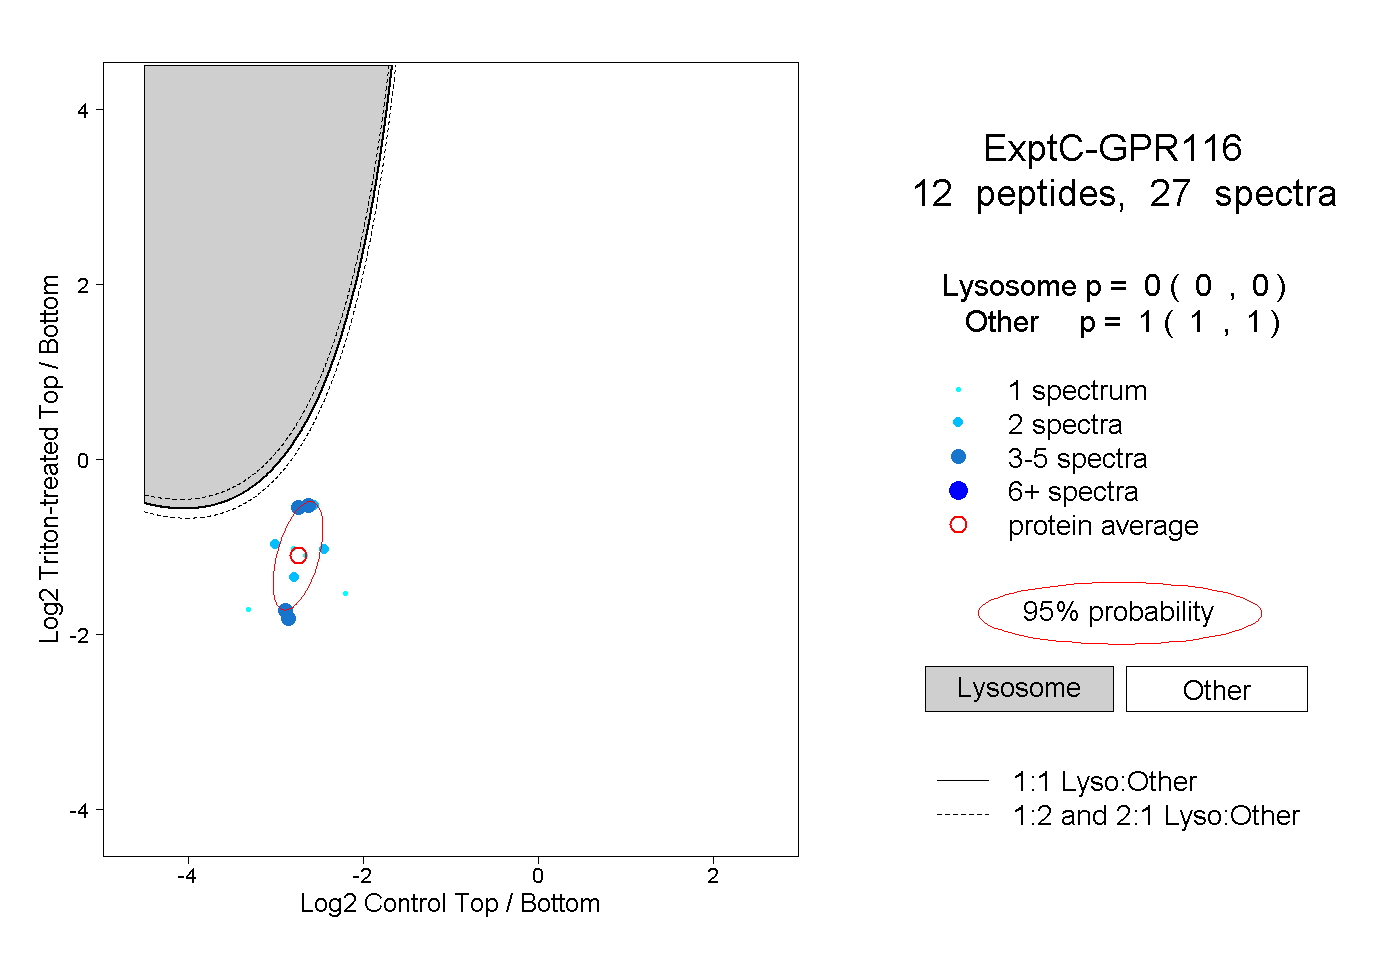
0.000 | 0.000
1.000 | 1.000
1peptide
spectrum
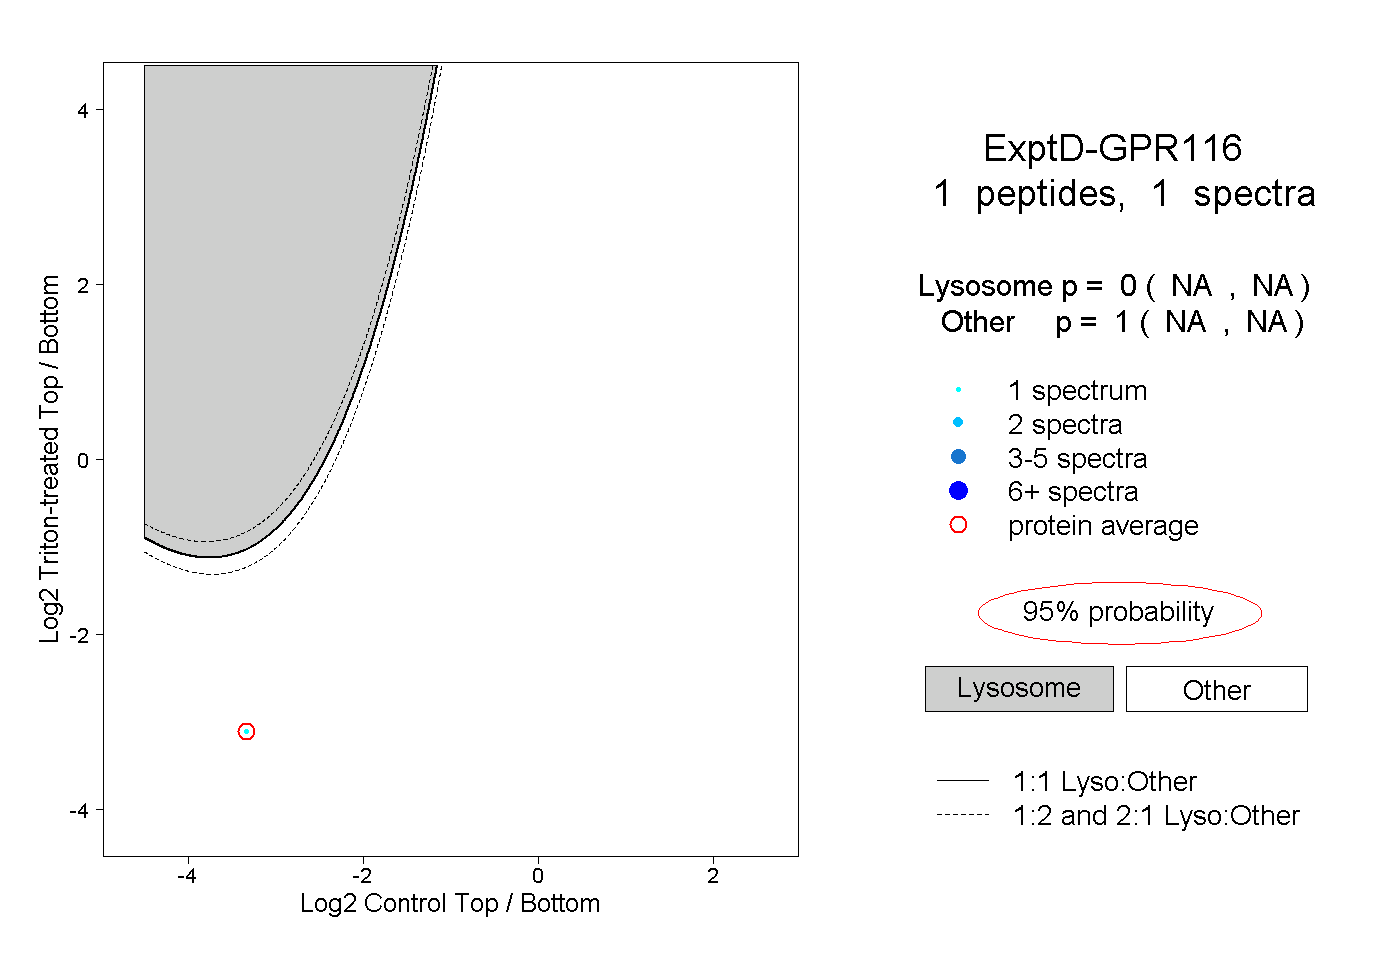
NA | NA
NA | NA