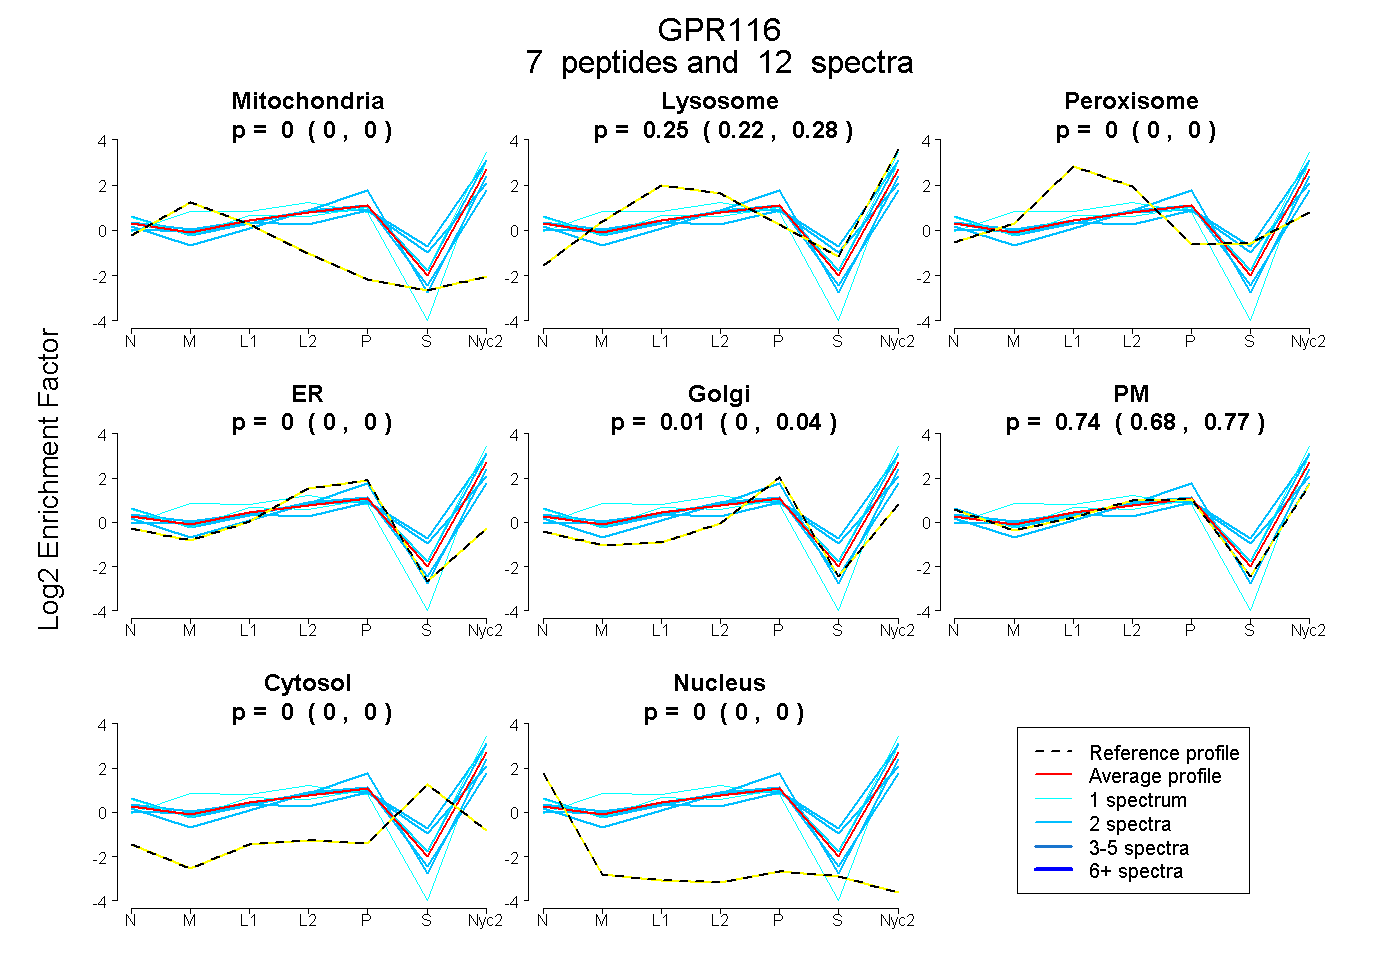
 7
7peptides
spectra
0.000 | 0.000
0.217 | 0.275
0.000 | 0.000
0.000 | 0.000
0.000 | 0.041
0.685 | 0.774
0.000 | 0.000
0.000 | 0.000
| Plot | Mito | Lyso | Perox | ER | Golgi | PM | Cytosol | Nucleus | |||||
| Expt A |
7 peptides |
12 spectra |
|
0.000 0.000 | 0.000 |
0.247 0.217 | 0.275 |
0.000 0.000 | 0.000 |
0.000 0.000 | 0.000 |
0.012 0.000 | 0.041 |
0.741 0.685 | 0.774 |
0.000 0.000 | 0.000 |
0.000 0.000 | 0.000 |
| 2 spectra, FYTMR | 0.000 | 0.461 | 0.000 | 0.000 | 0.000 | 0.455 | 0.083 | 0.000 | ||
| 2 spectra, LCQFAGVSR | 0.001 | 0.016 | 0.000 | 0.000 | 0.000 | 0.983 | 0.000 | 0.000 | ||
| 2 spectra, AILAQDGQR | 0.000 | 0.321 | 0.000 | 0.000 | 0.000 | 0.679 | 0.000 | 0.000 | ||
| 1 spectrum, DILATINVILDK | 0.000 | 0.297 | 0.000 | 0.000 | 0.000 | 0.703 | 0.000 | 0.000 | ||
| 1 spectrum, VQEALLHK | 0.000 | 0.334 | 0.000 | 0.000 | 0.000 | 0.666 | 0.000 | 0.000 | ||
| 2 spectra, GHAQMYQQK | 0.000 | 0.227 | 0.000 | 0.000 | 0.000 | 0.624 | 0.149 | 0.000 | ||
| 2 spectra, SSLFQISK | 0.000 | 0.099 | 0.000 | 0.000 | 0.241 | 0.660 | 0.000 | 0.000 |
| Plot | Lyso | Other | |||||||||||
| Expt C |
12 peptides |
27 spectra |
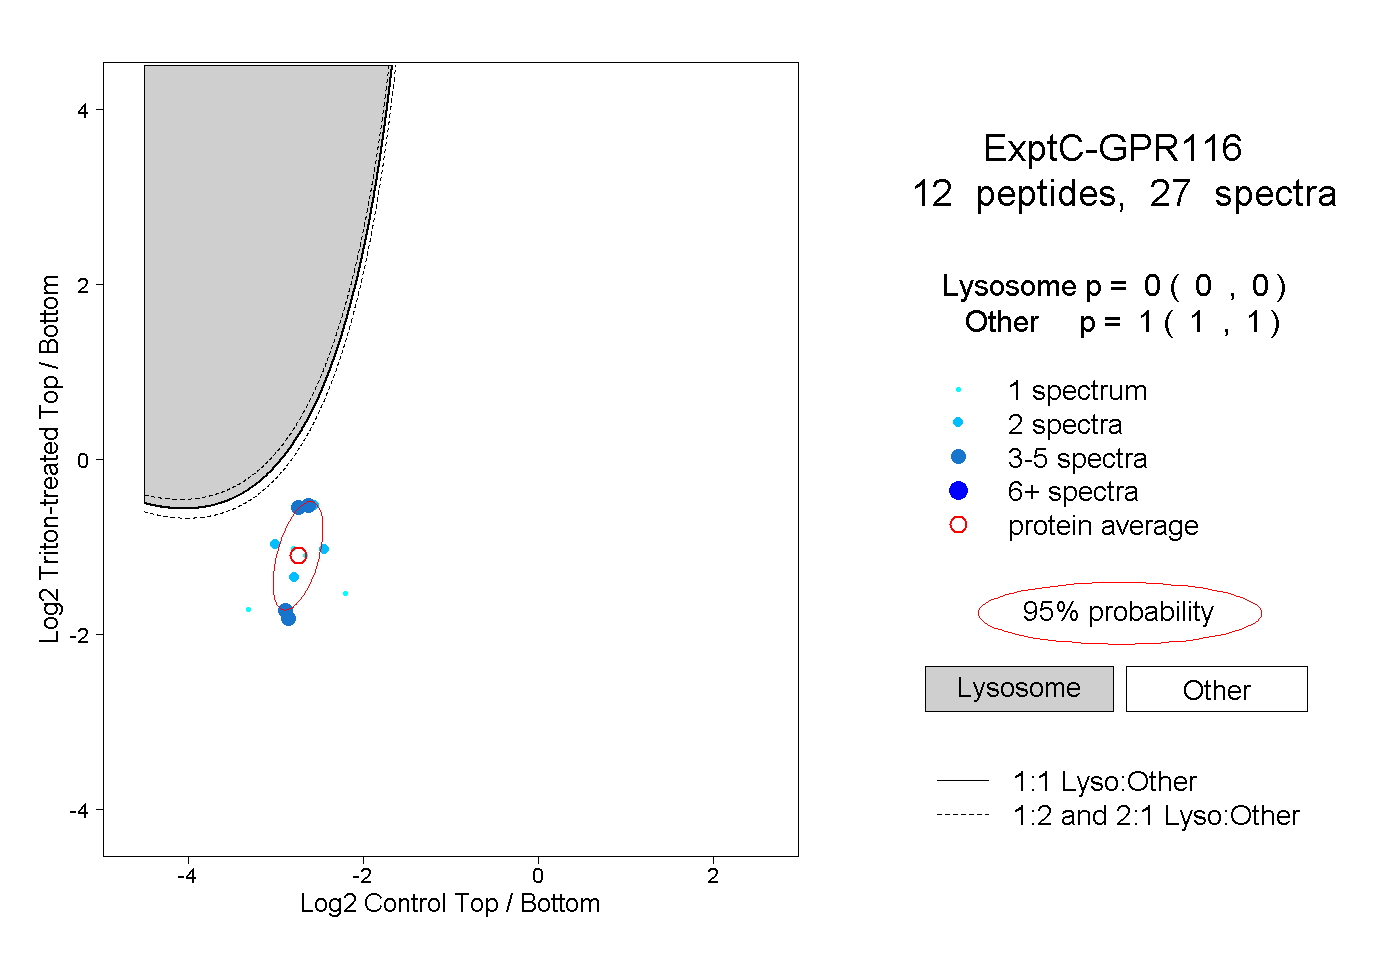 |
0.000 0.000 | 0.000 |
1.000 1.000 | 1.000 |
||||||||
| Plot | Lyso | Other | |||||||||||
| Expt D |
1 peptide |
1 spectrum |
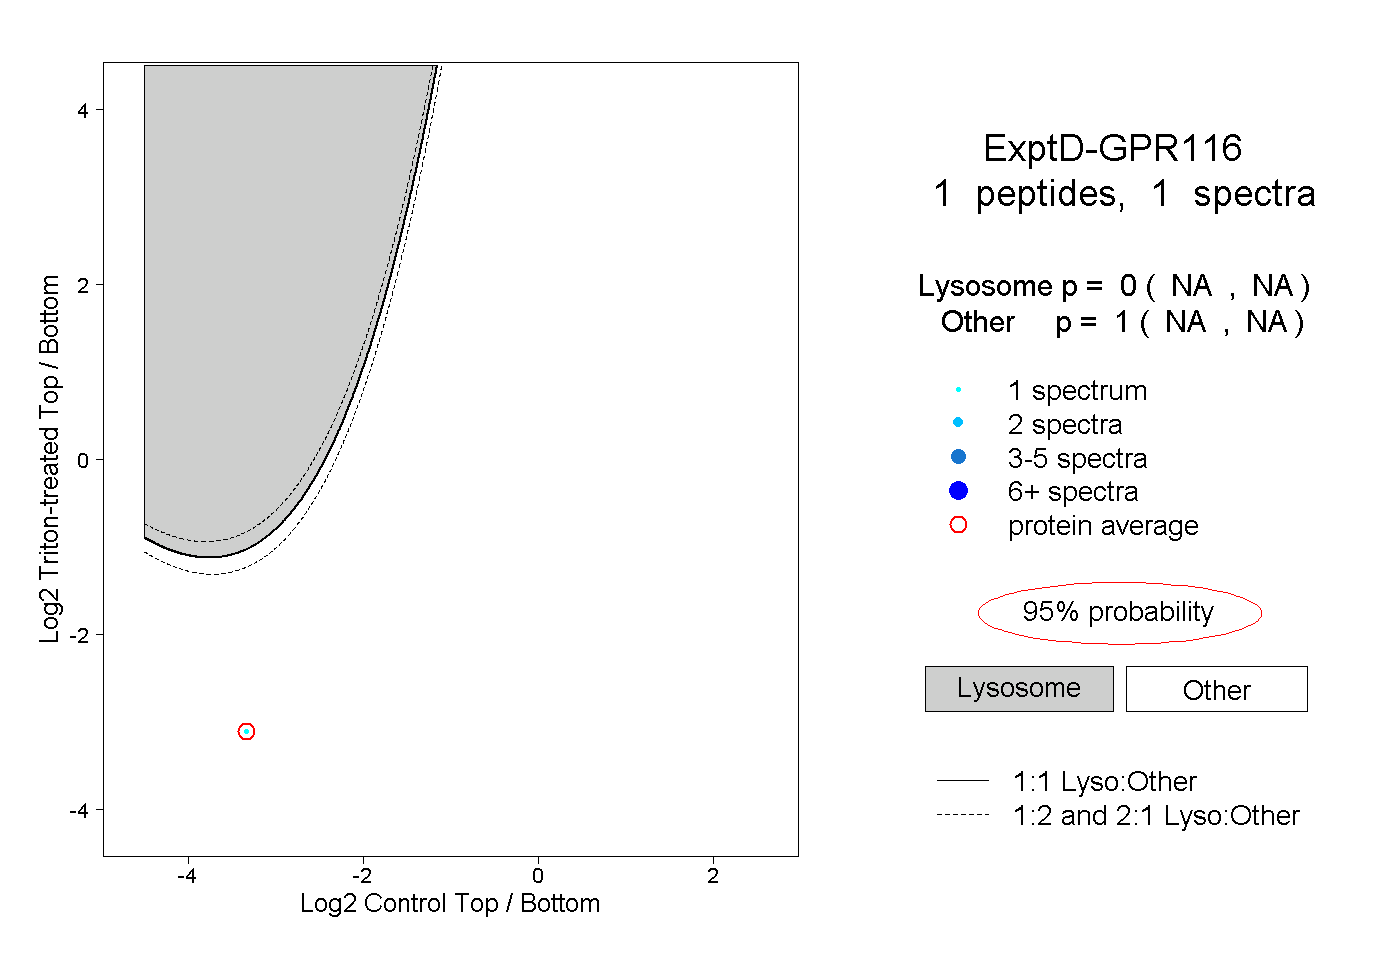 |
0.000 NA | NA |
1.000 NA | NA |