 6
6peptides
spectra
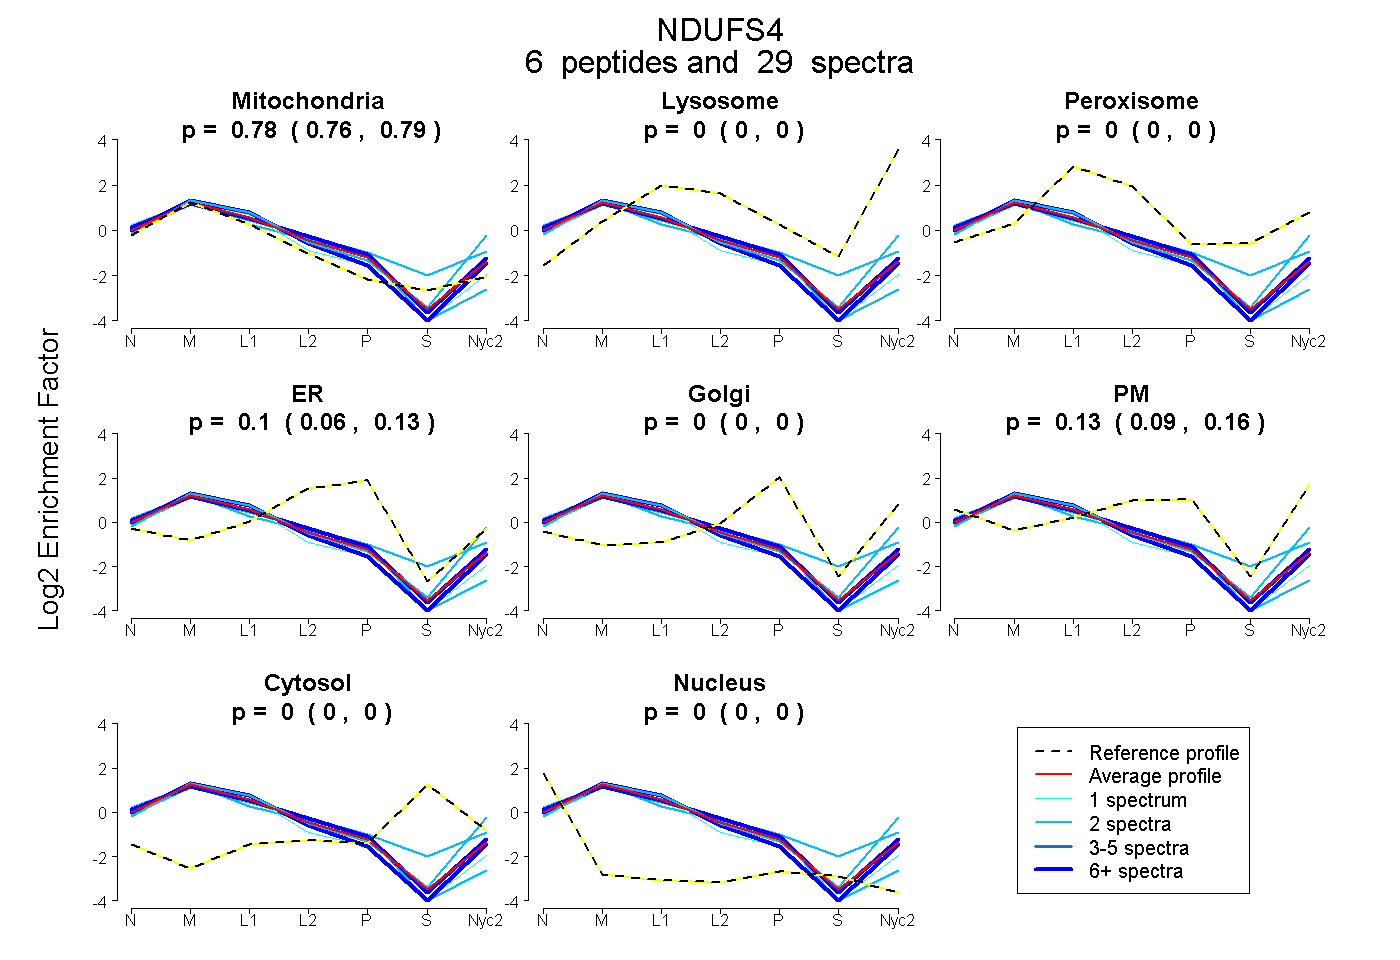
0.764 | 0.786
0.000 | 0.000
0.000 | 0.000
0.062 | 0.126
0.000 | 0.000
0.085 | 0.164
0.000 | 0.000
0.000 | 0.000
4peptides
spectra
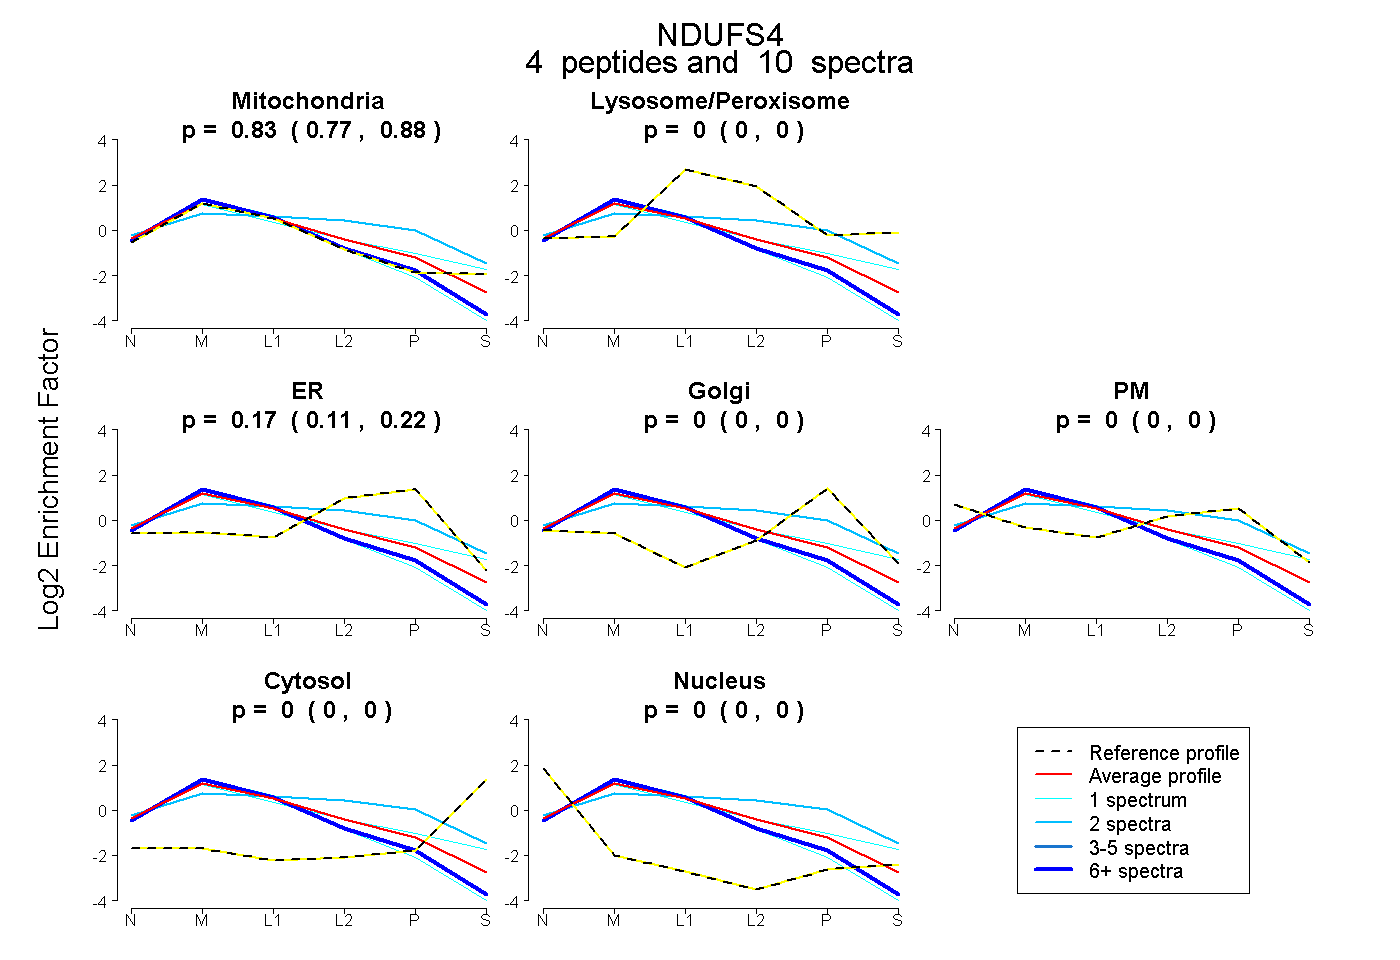
0.771 | 0.877
0.000 | 0.001
0.113 | 0.217
0.000 | 0.000
0.000 | 0.000
0.000 | 0.000
0.000 | 0.000
8peptides
spectra
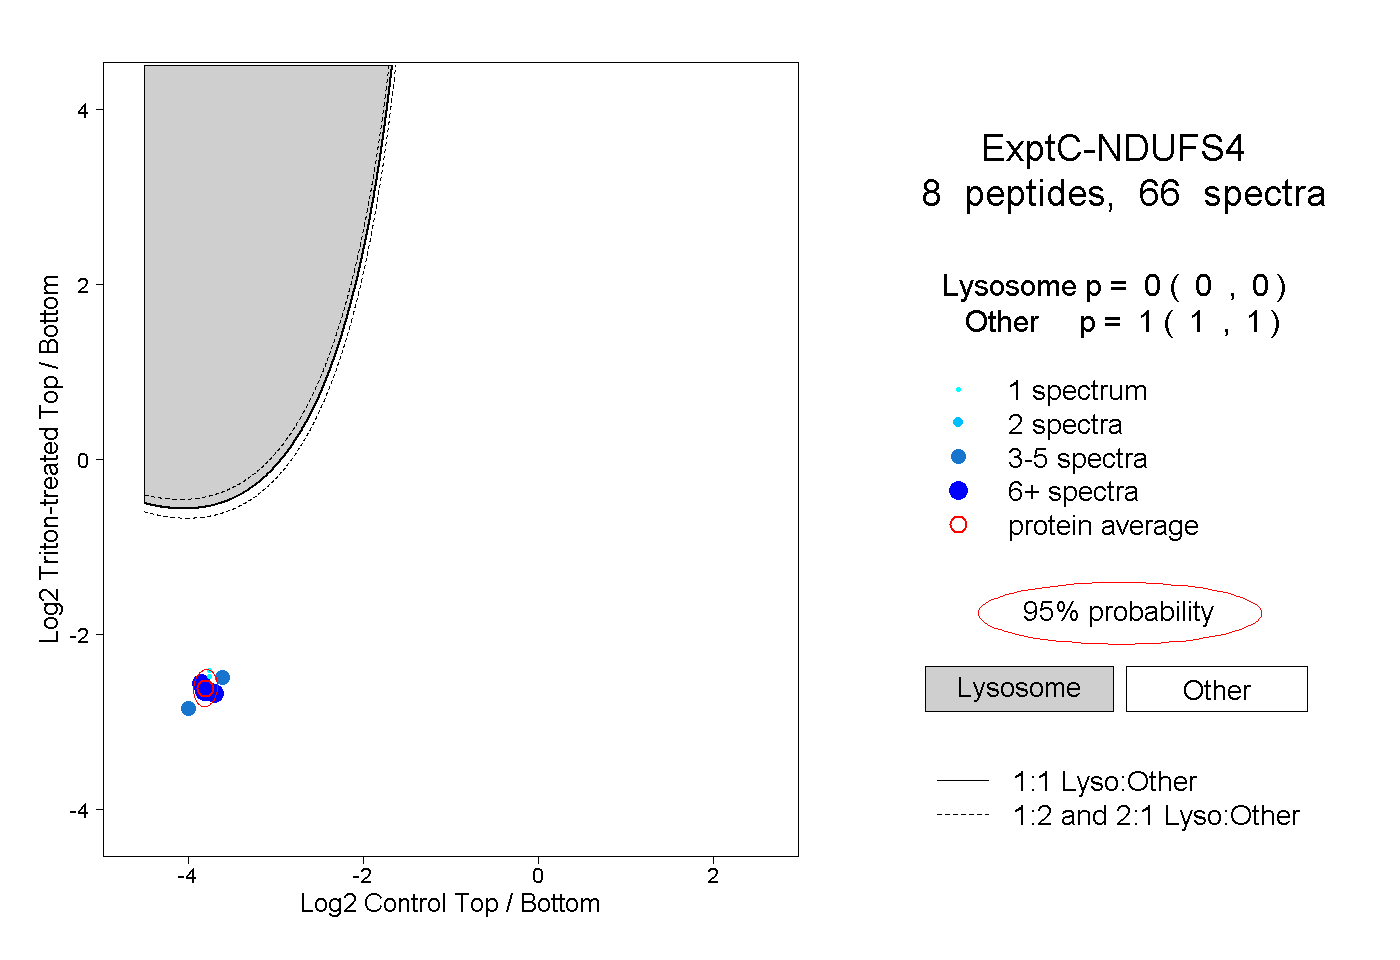
0.000 | 0.000
1.000 | 1.000
3peptides
spectra
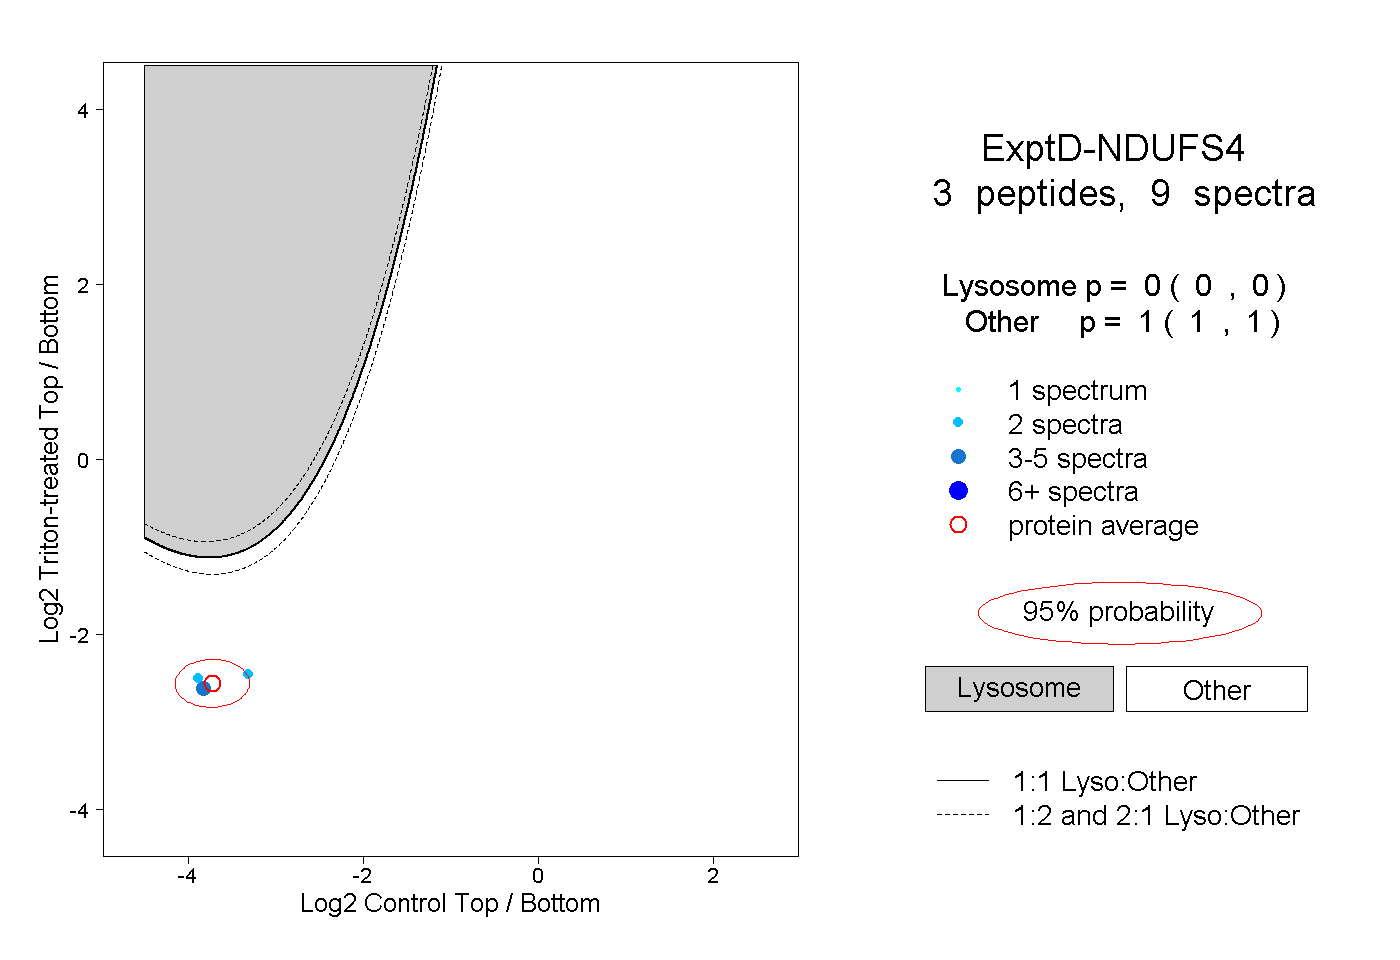
0.000 | 0.000
1.000 | 1.000