NDUFS4
[ENSRNOP00000015217]
Main page
| | | Plot |
Mito |
Lyso |
|
Perox |
ER |
Golgi |
PM |
Cytosol |
Nucleus |
|
| Expt A |
 6
6
peptides |
29
spectra |
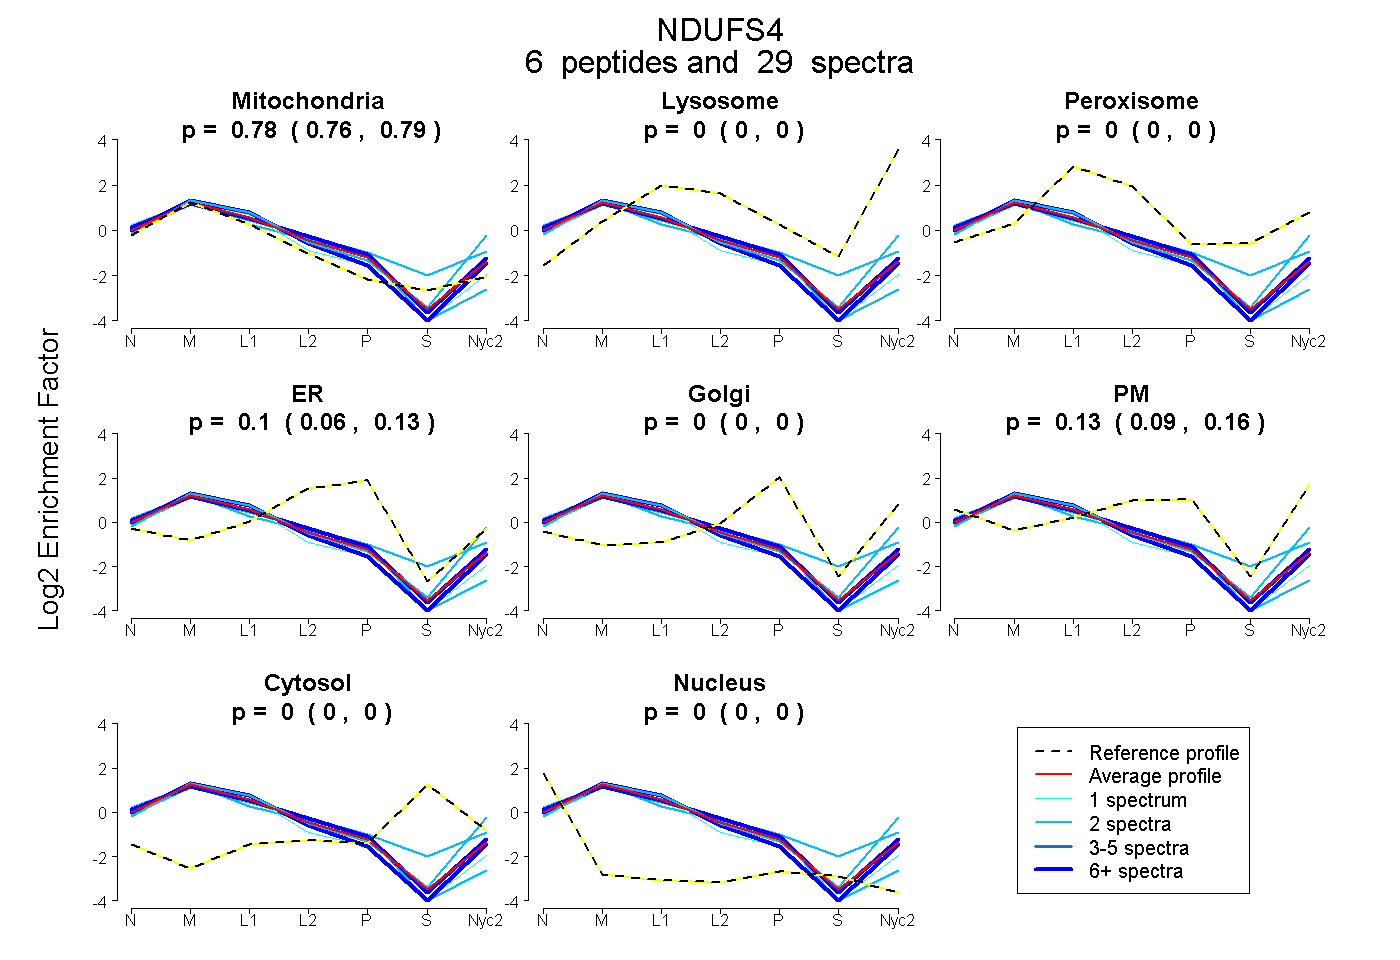 |
0.776
0.764 | 0.786 |
0.000
0.000 | 0.000 |
|
0.000
0.000 | 0.000 |
0.096
0.062 | 0.126 |
0.000
0.000 | 0.000 |
0.128
0.085 | 0.164 |
0.000
0.000 | 0.000 |
0.000
0.000 | 0.000 |
|
| | | Plot |
Mito |
|
Lyso or Perox |
|
ER |
Golgi |
PM |
Cytosol |
Nucleus |
|
| Expt B |
4
peptides |
10
spectra |
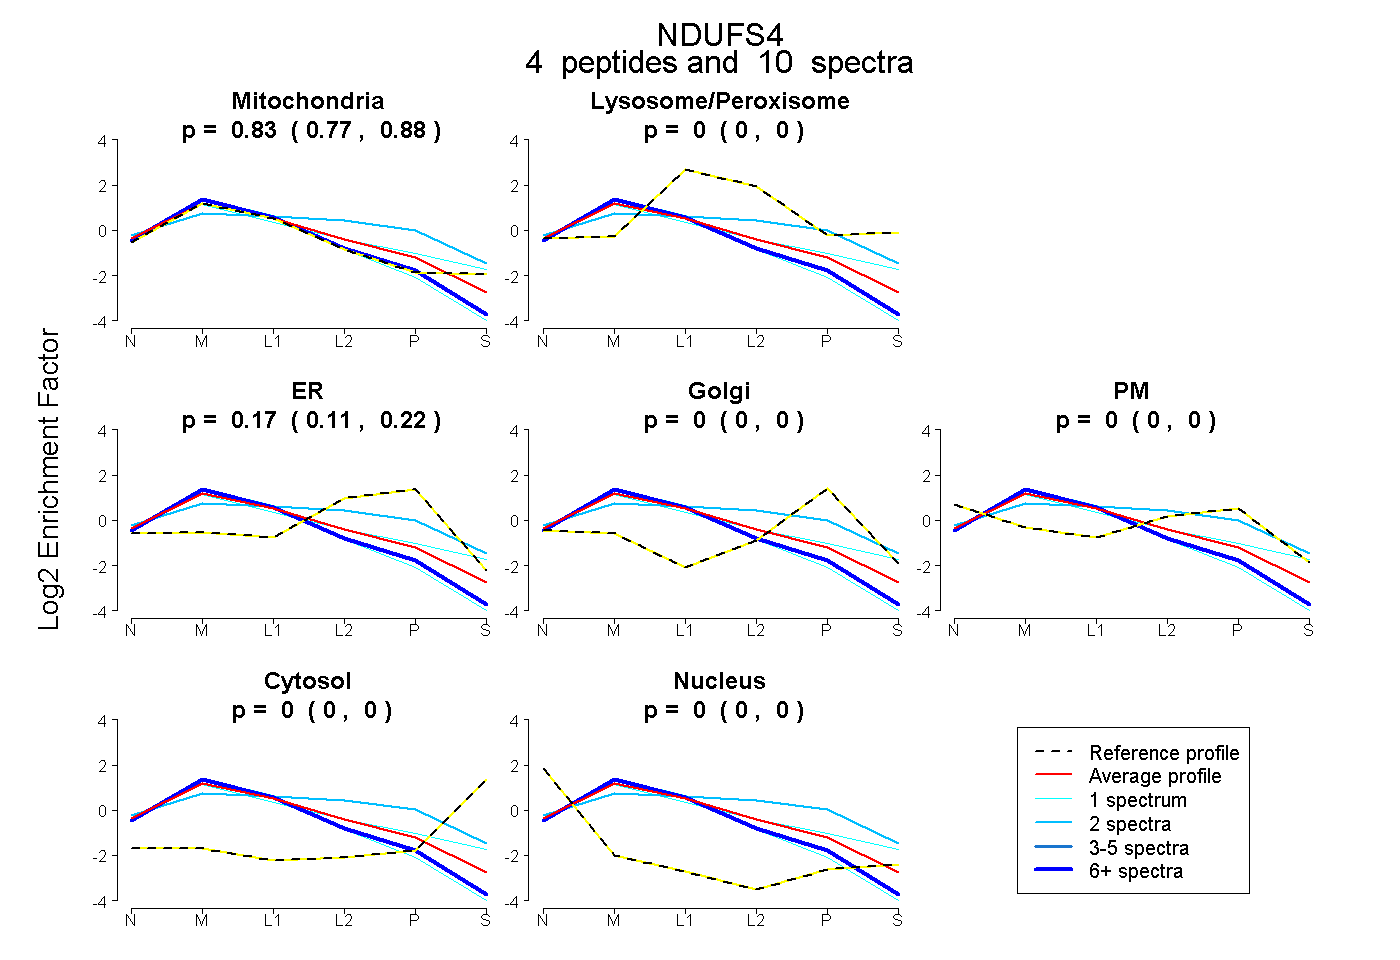 |
0.829
0.771 | 0.877 |
|
0.000
0.000 | 0.001 |
|
0.171
0.113 | 0.217 |
0.000
0.000 | 0.000 |
0.000
0.000 | 0.000 |
0.000
0.000 | 0.000 |
0.000
0.000 | 0.000 |
|
| 1 spectrum, EDAVAFAEK |
0.989 |
|
0.000 |
|
0.000 |
0.000 |
0.000 |
0.000 |
0.011 |
|
| 6 spectra, IFVPAR |
0.971 |
|
0.000 |
|
0.027 |
0.000 |
0.000 |
0.000 |
0.002 |
|
| 2 spectra, HGWSYDVEGR |
0.366 |
|
0.245 |
|
0.255 |
0.000 |
0.135 |
0.000 |
0.000 |
|
| 1 spectrum, DTQLITVDEK |
0.732 |
|
0.053 |
|
0.065 |
0.006 |
0.144 |
0.000 |
0.000 |
|
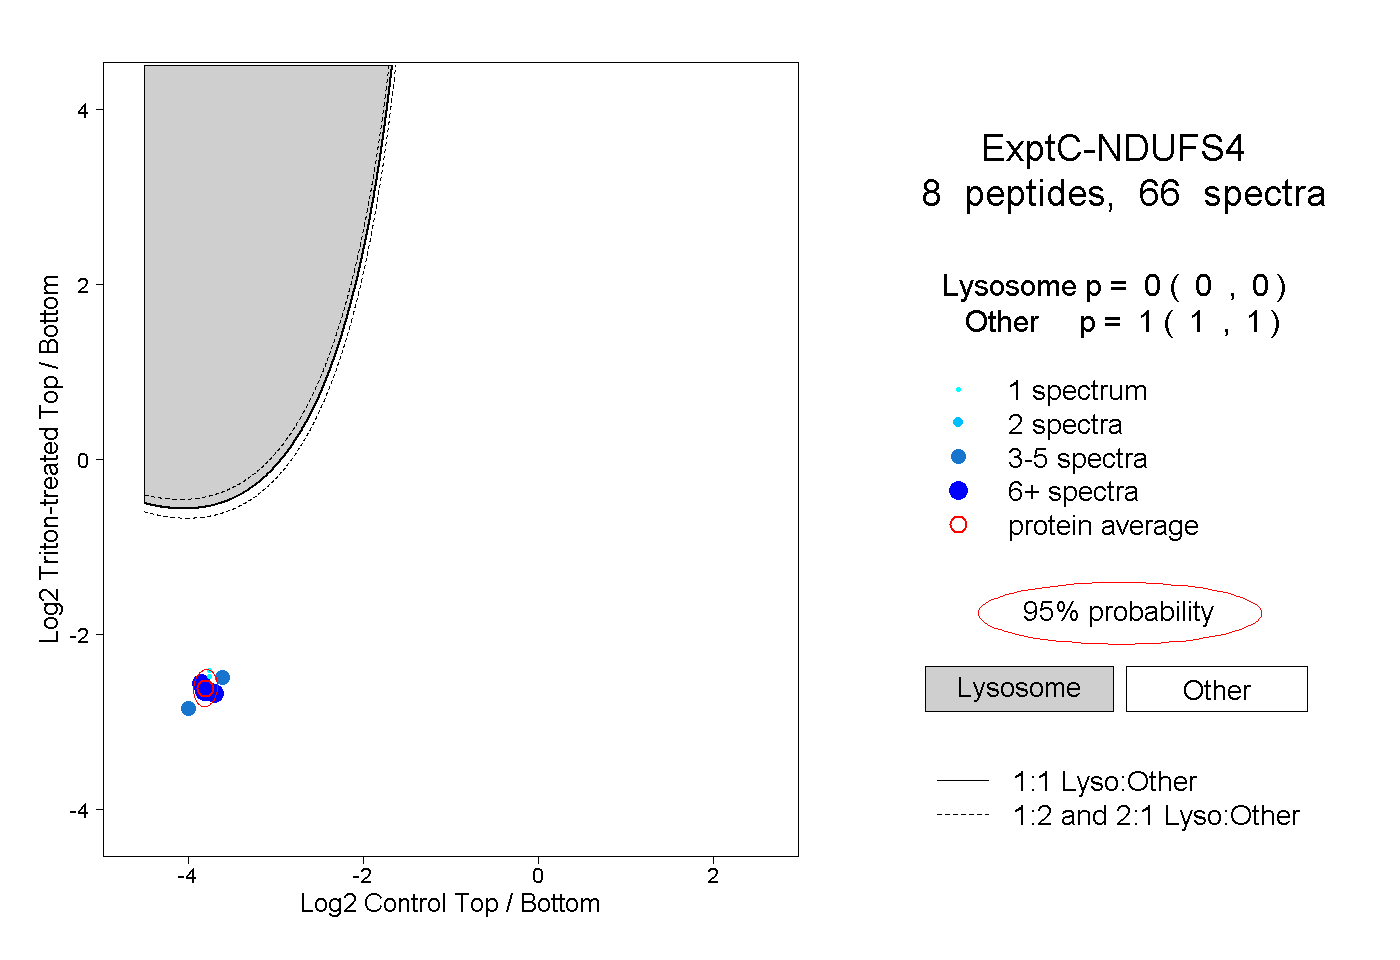
| | | Plot |
|
Lyso |
|
|
|
|
|
|
|
Other |
| Expt C |
8
peptides |
66
spectra |
 |
|
0.000
0.000 | 0.000 |
|
|
|
|
|
|
|
1.000
1.000 | 1.000 |
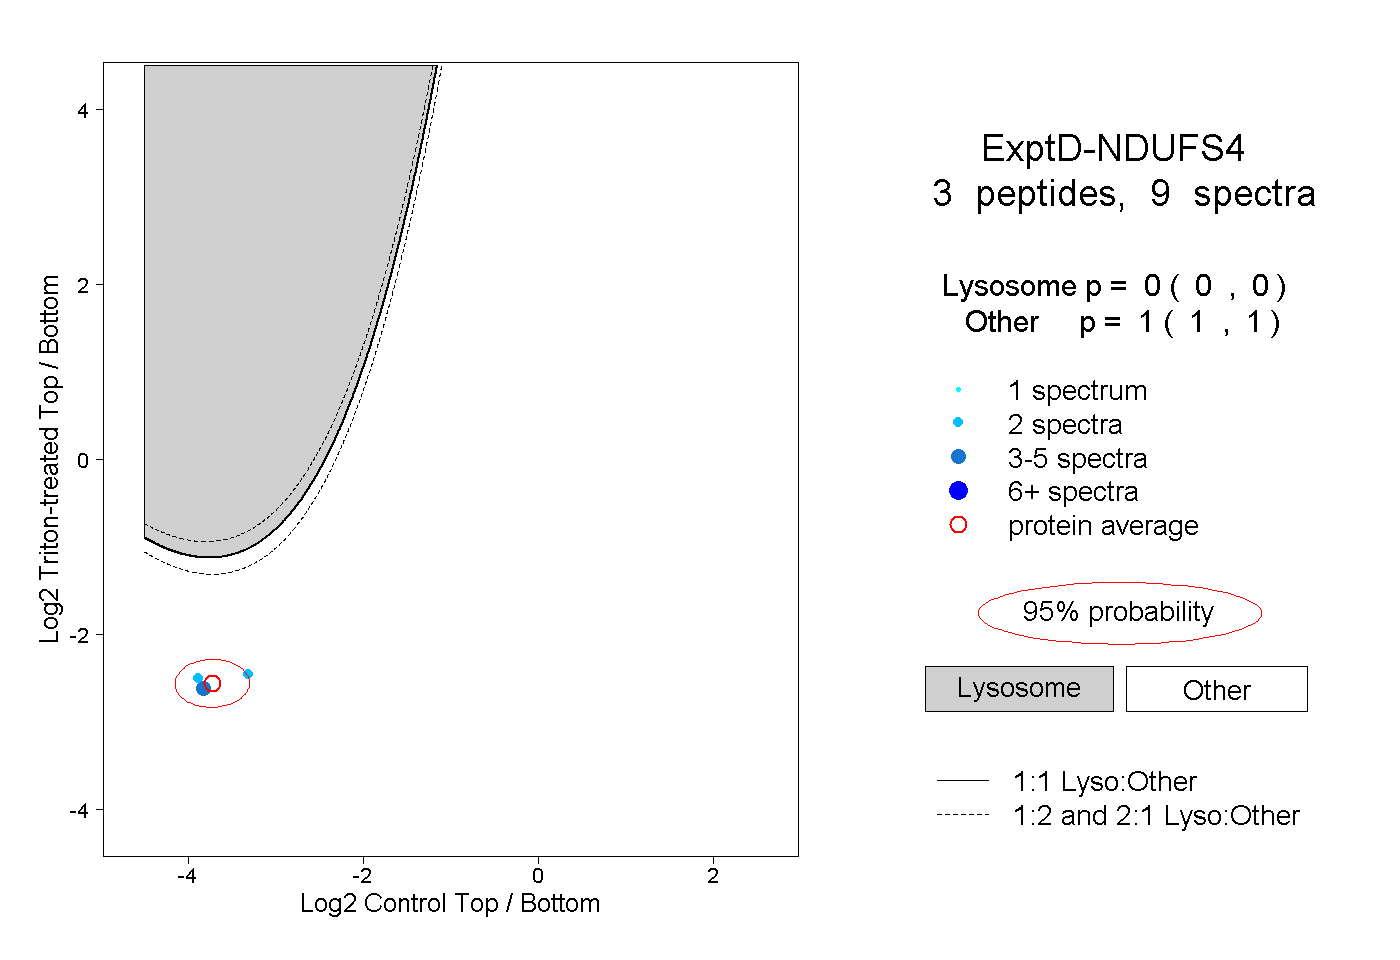
| | | Plot |
|
Lyso |
|
|
|
|
|
|
|
Other |
| Expt D |
3
peptides |
9
spectra |
 |
|
0.000
0.000 | 0.000 |
|
|
|
|
|
|
|
1.000
1.000 | 1.000 |