 5
5peptides
spectra
0.000 | 0.000
0.000 | 0.215
0.000 | 0.374
0.000 | 0.057
0.000 | 0.267
0.000 | 0.414
0.273 | 0.431
0.000 | 0.000
5peptides
spectra
0.000 | 0.000
1.000 | 1.000
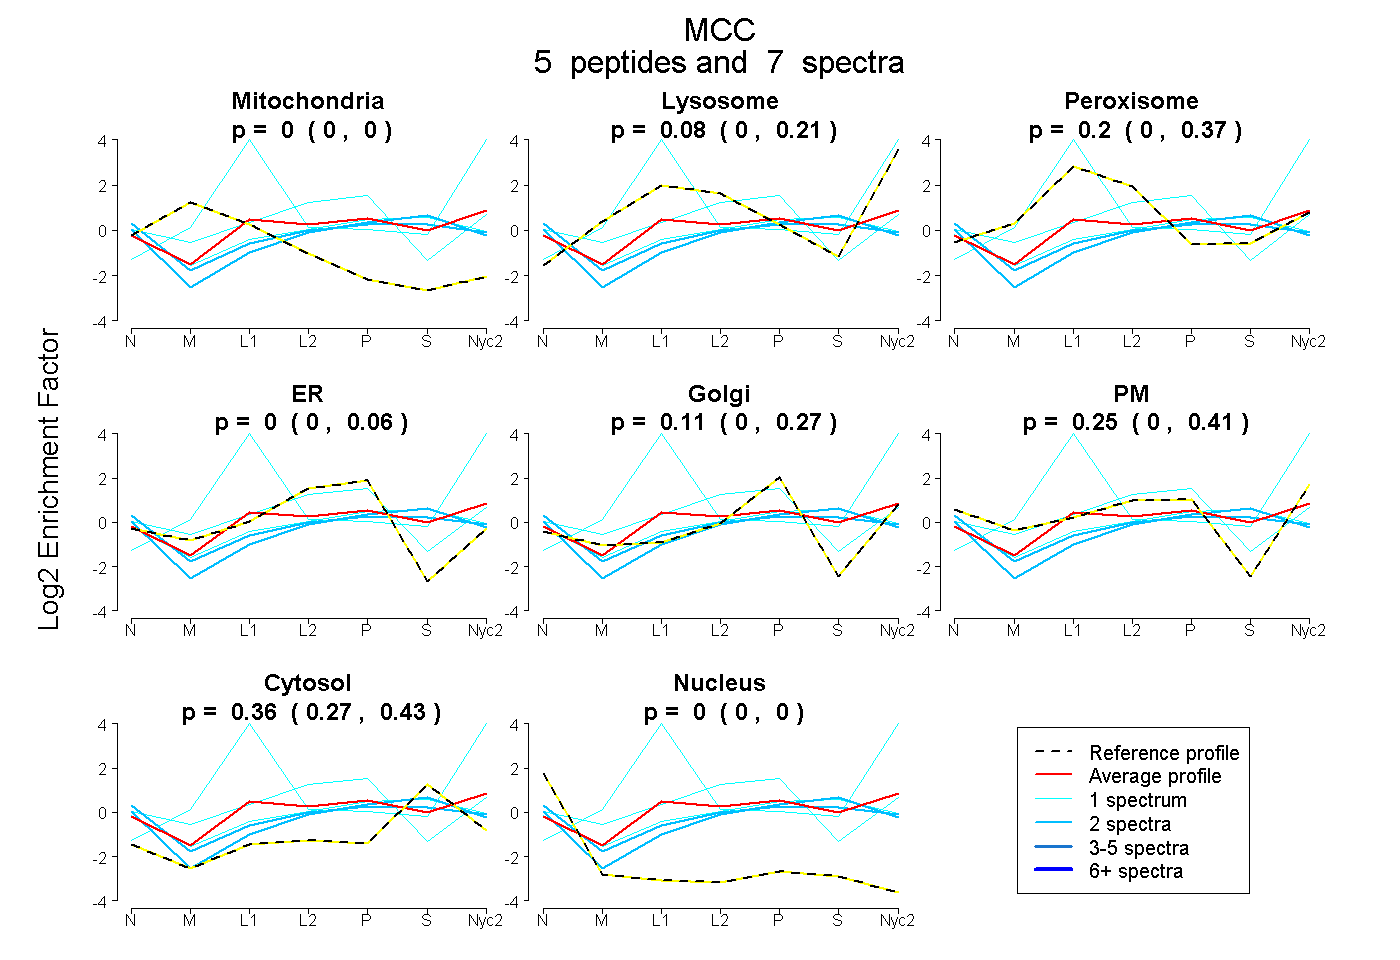
| Plot | Mito | Lyso | Perox | ER | Golgi | PM | Cytosol | Nucleus | |||||
| Expt A |
5 peptides |
7 spectra |
|
0.000 0.000 | 0.000 |
0.079 0.000 | 0.215 |
0.197 0.000 | 0.374 |
0.000 0.000 | 0.057 |
0.114 0.000 | 0.267 |
0.249 0.000 | 0.414 |
0.361 0.273 | 0.431 |
0.000 0.000 | 0.000 |
||
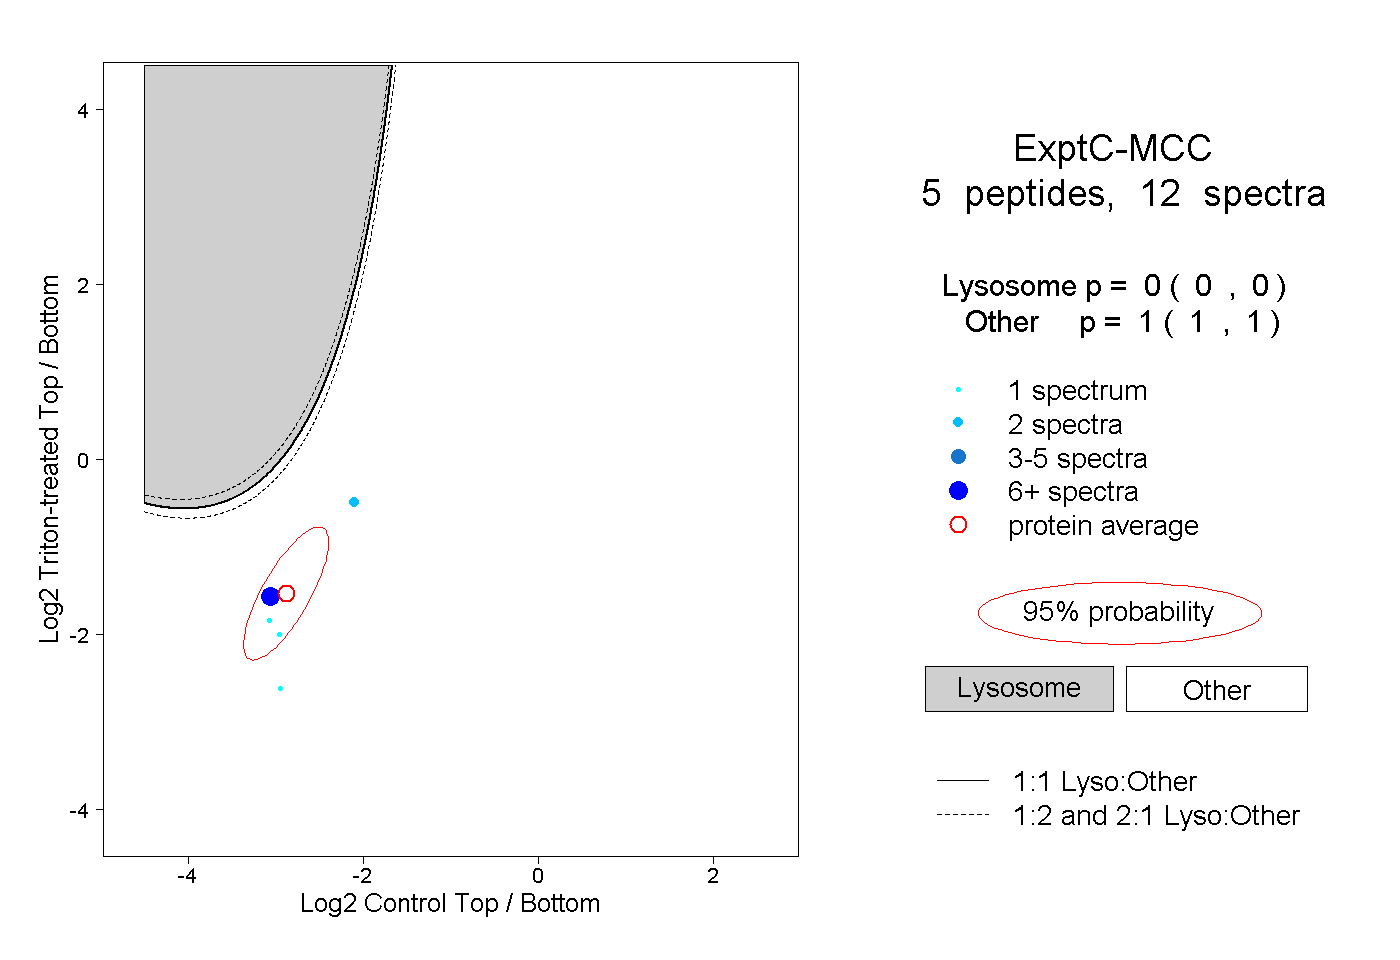
| Plot | Lyso | Other | |||||||||||
| Expt C |
5 peptides |
12 spectra |
|
0.000 0.000 | 0.000 |
1.000 1.000 | 1.000 |