 5
5peptides
spectra
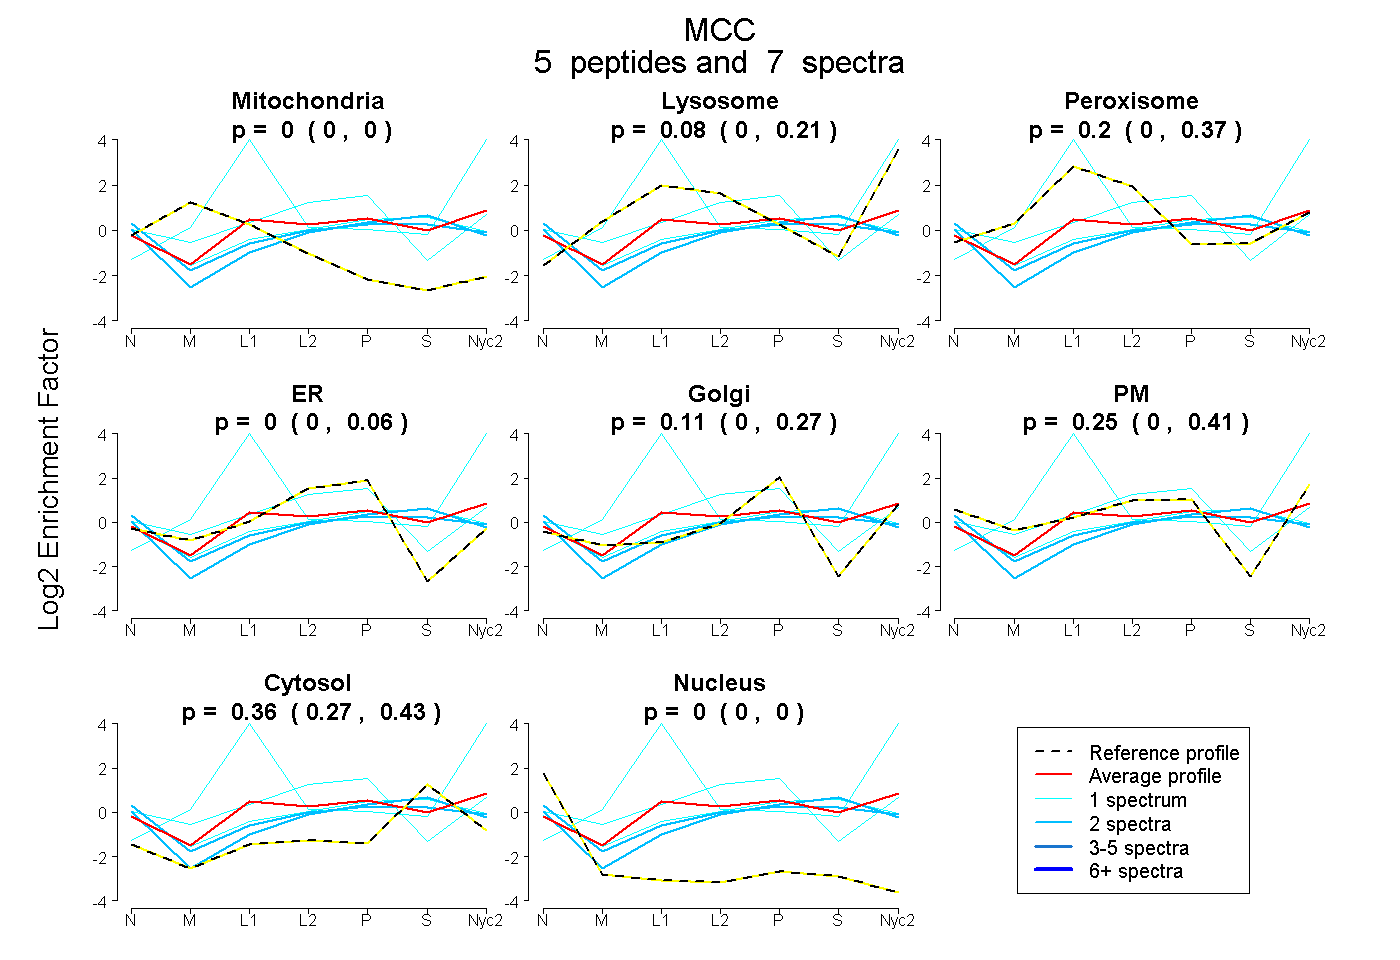
0.000 | 0.000
0.000 | 0.215
0.000 | 0.374
0.000 | 0.057
0.000 | 0.267
0.000 | 0.414
0.273 | 0.431
0.000 | 0.000
| Plot | Mito | Lyso | Perox | ER | Golgi | PM | Cytosol | Nucleus | |||||
| Expt A |
5 peptides |
7 spectra |
|
0.000 0.000 | 0.000 |
0.079 0.000 | 0.215 |
0.197 0.000 | 0.374 |
0.000 0.000 | 0.057 |
0.114 0.000 | 0.267 |
0.249 0.000 | 0.414 |
0.361 0.273 | 0.431 |
0.000 0.000 | 0.000 |
| 2 spectra, TVEEIEGVLGR | 0.000 | 0.000 | 0.000 | 0.171 | 0.009 | 0.175 | 0.645 | 0.000 | ||
| 1 spectrum, TAENAAK | 0.000 | 0.897 | 0.103 | 0.000 | 0.000 | 0.000 | 0.000 | 0.000 | ||
| 2 spectra, LQSVQATGPSSPGR | 0.000 | 0.000 | 0.010 | 0.111 | 0.000 | 0.341 | 0.538 | 0.000 | ||
| 1 spectrum, EFEVETER | 0.000 | 0.000 | 0.104 | 0.135 | 0.045 | 0.187 | 0.529 | 0.000 | ||
| 1 spectrum, ELAGLR | 0.000 | 0.007 | 0.215 | 0.311 | 0.214 | 0.213 | 0.039 | 0.000 |
| Plot | Lyso | Other | |||||||||||
| Expt C |
5 peptides |
12 spectra |
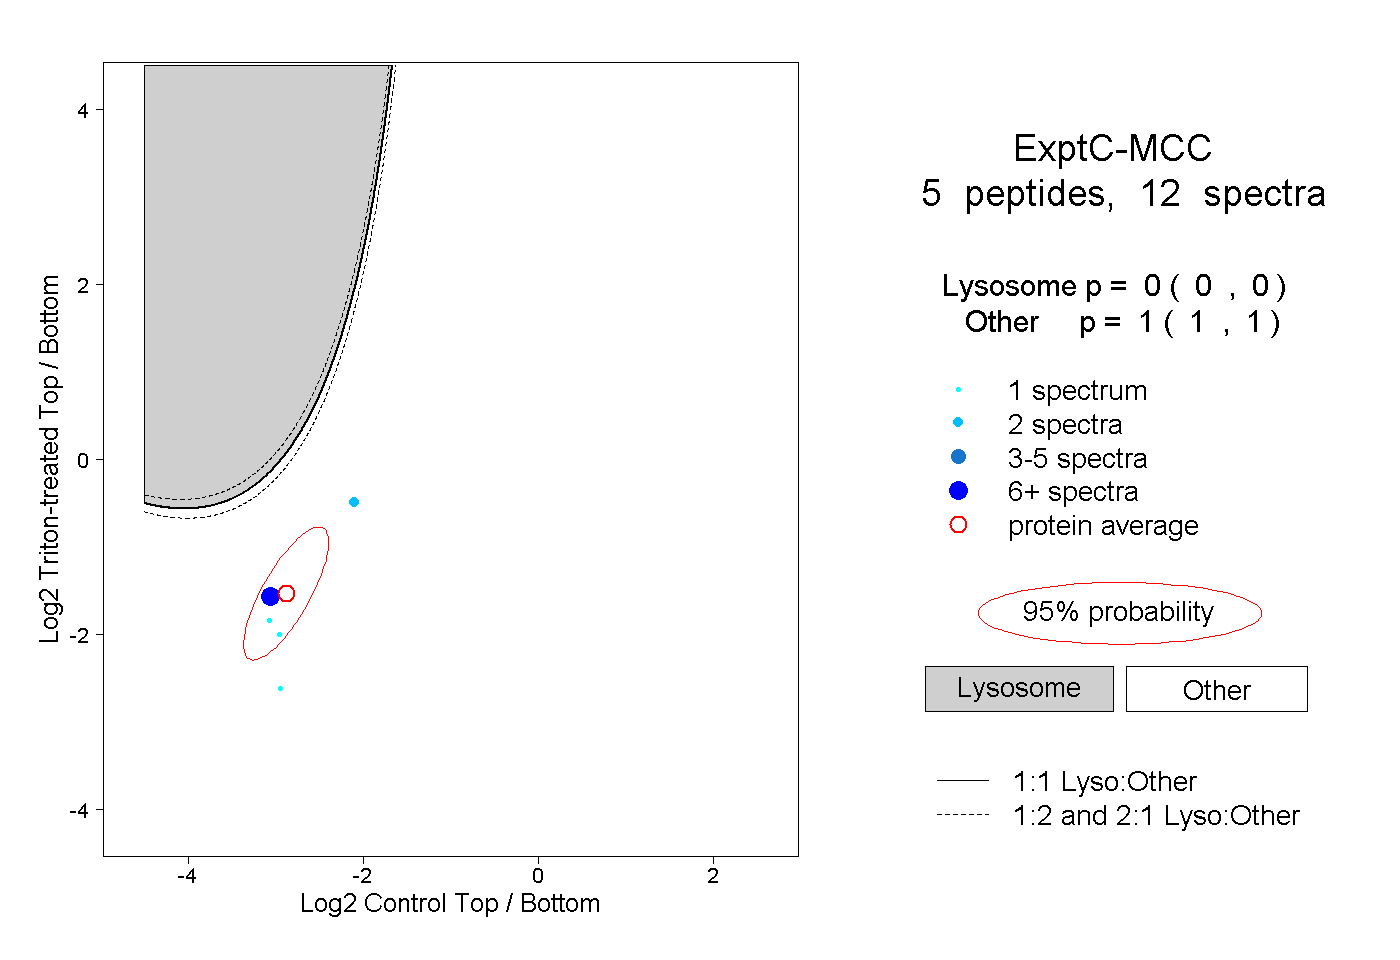 |
0.000 0.000 | 0.000 |
1.000 1.000 | 1.000 |