 5
5peptides
spectra
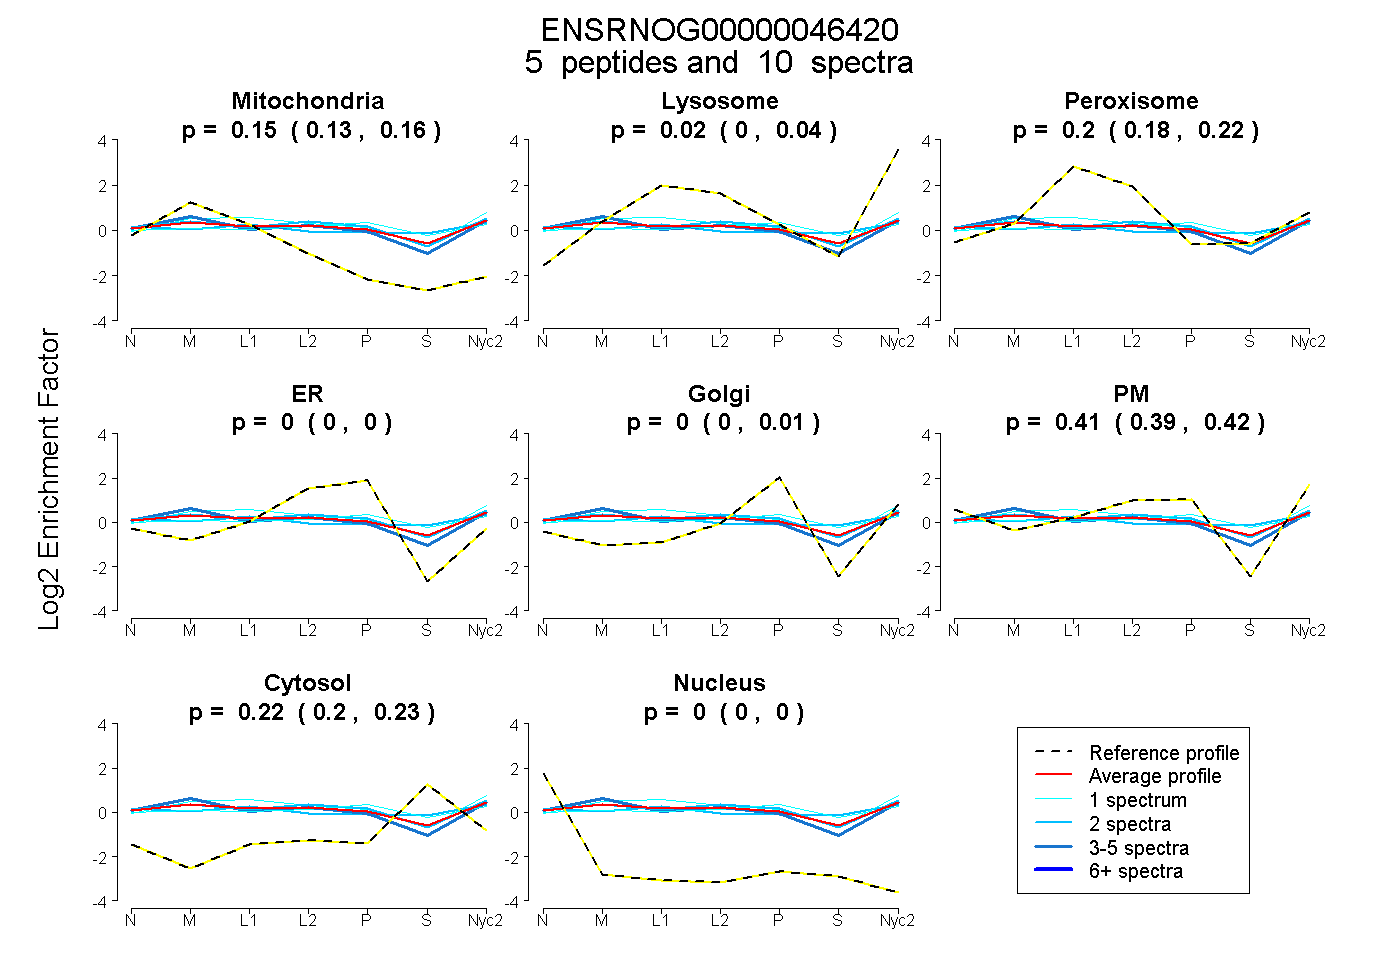
0.130 | 0.165
0.000 | 0.038
0.178 | 0.224
0.000 | 0.000
0.000 | 0.014
0.387 | 0.421
0.204 | 0.233
0.000 | 0.000
2peptides
spectra
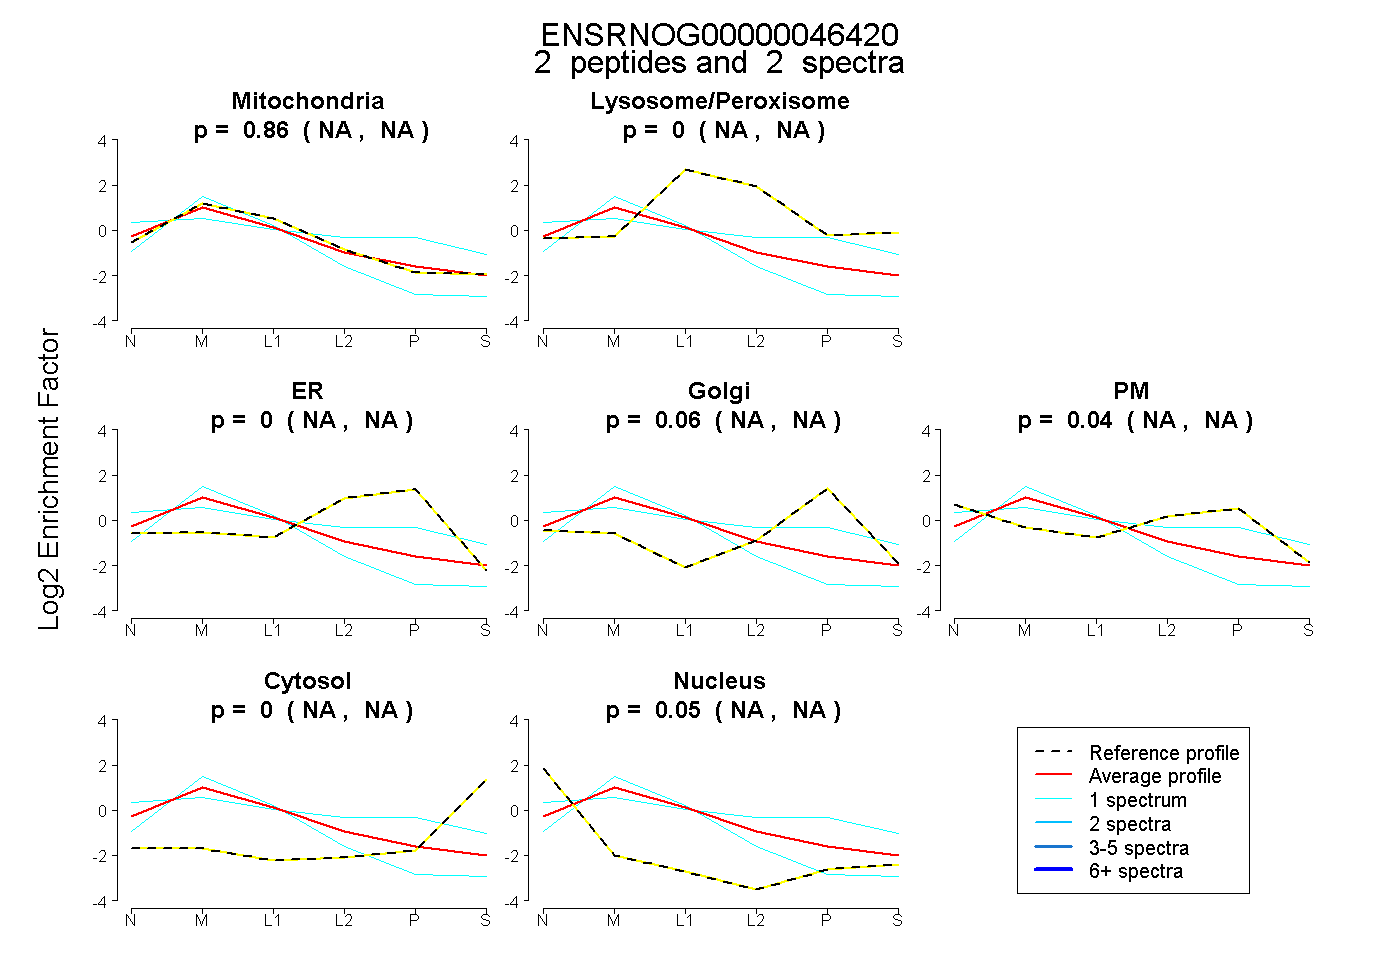
NA | NA
NA | NA
NA | NA
NA | NA
NA | NA
NA | NA
NA | NA
15peptides
spectra
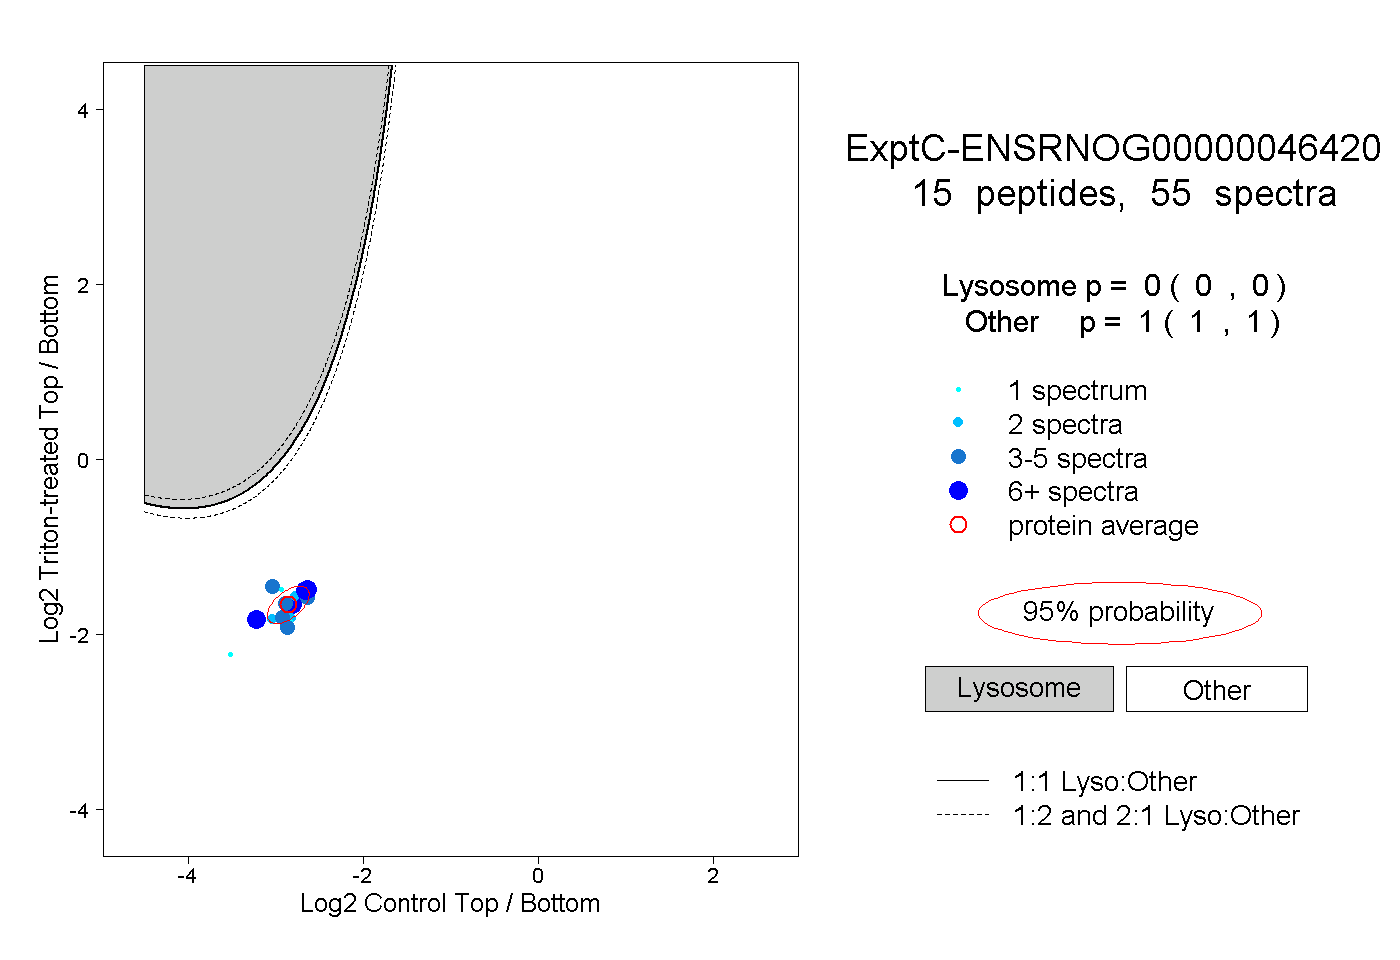
0.000 | 0.000
1.000 | 1.000
2peptides
spectra
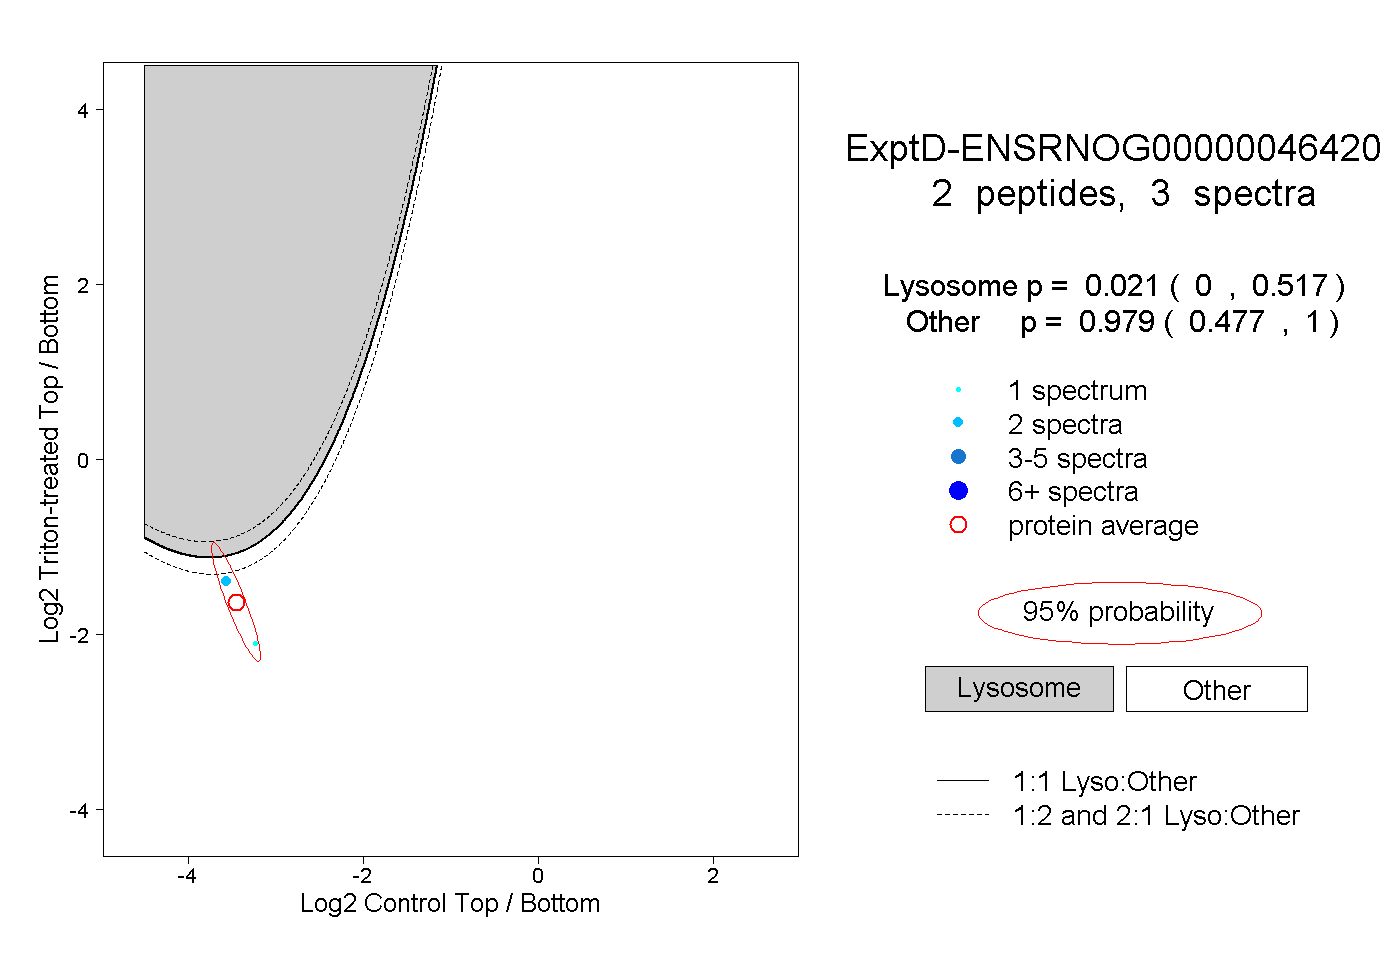
0.000 | 0.517
0.477 | 1.000