 5
5peptides
spectra
0.130 | 0.165
0.000 | 0.038
0.178 | 0.224
0.000 | 0.000
0.000 | 0.014
0.387 | 0.421
0.204 | 0.233
0.000 | 0.000
| Plot | Mito | Lyso | Perox | ER | Golgi | PM | Cytosol | Nucleus | |||||
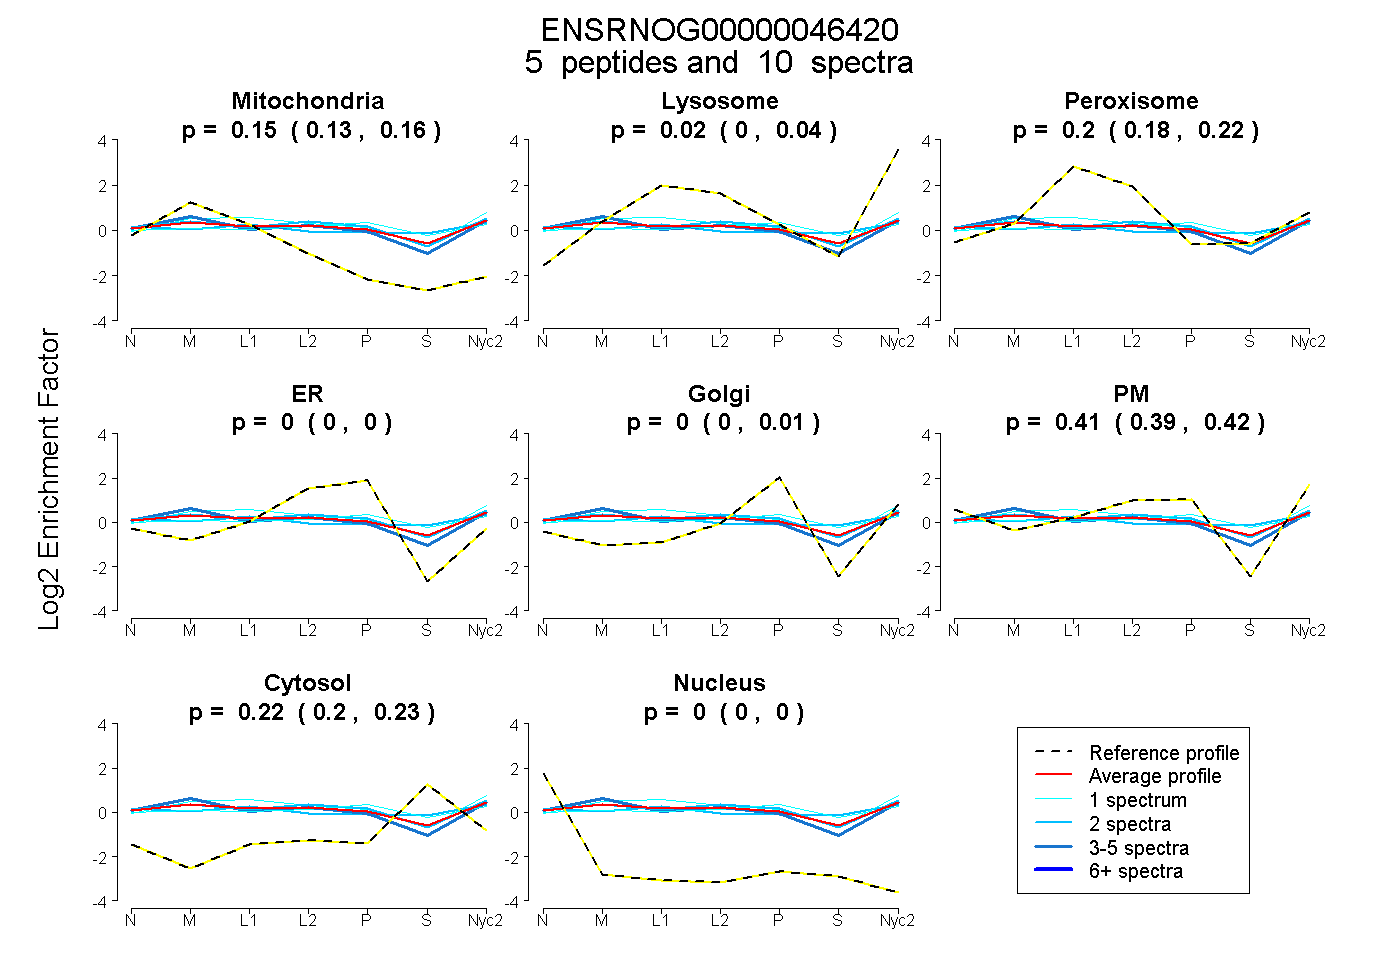
| Expt A |
5 peptides |
10 spectra |
|
0.148 0.130 | 0.165 |
0.020 0.000 | 0.038 |
0.203 0.178 | 0.224 |
0.000 0.000 | 0.000 |
0.000 0.000 | 0.014 |
0.408 0.387 | 0.421 |
0.221 0.204 | 0.233 |
0.000 0.000 | 0.000 |
| 4 spectra, ILEPHVIAVR | 0.260 | 0.088 | 0.090 | 0.000 | 0.000 | 0.415 | 0.147 | 0.000 | ||
| 2 spectra, AVYYTWADPVGSR | 0.106 | 0.000 | 0.255 | 0.000 | 0.000 | 0.335 | 0.304 | 0.000 | ||
| 1 spectrum, EYTESSPLEDK | 0.154 | 0.123 | 0.219 | 0.000 | 0.020 | 0.329 | 0.155 | 0.000 | ||
| 1 spectrum, VVELDNSIPVLLTPSGNDMK | 0.078 | 0.000 | 0.260 | 0.000 | 0.162 | 0.234 | 0.265 | 0.000 | ||
| 2 spectra, VLIQEMDLR | 0.132 | 0.007 | 0.205 | 0.000 | 0.011 | 0.451 | 0.193 | 0.000 |
| Plot | Mito | Lyso or Perox | ER | Golgi | PM | Cytosol | Nucleus | ||||||
| Expt B |
2 peptides |
2 spectra |
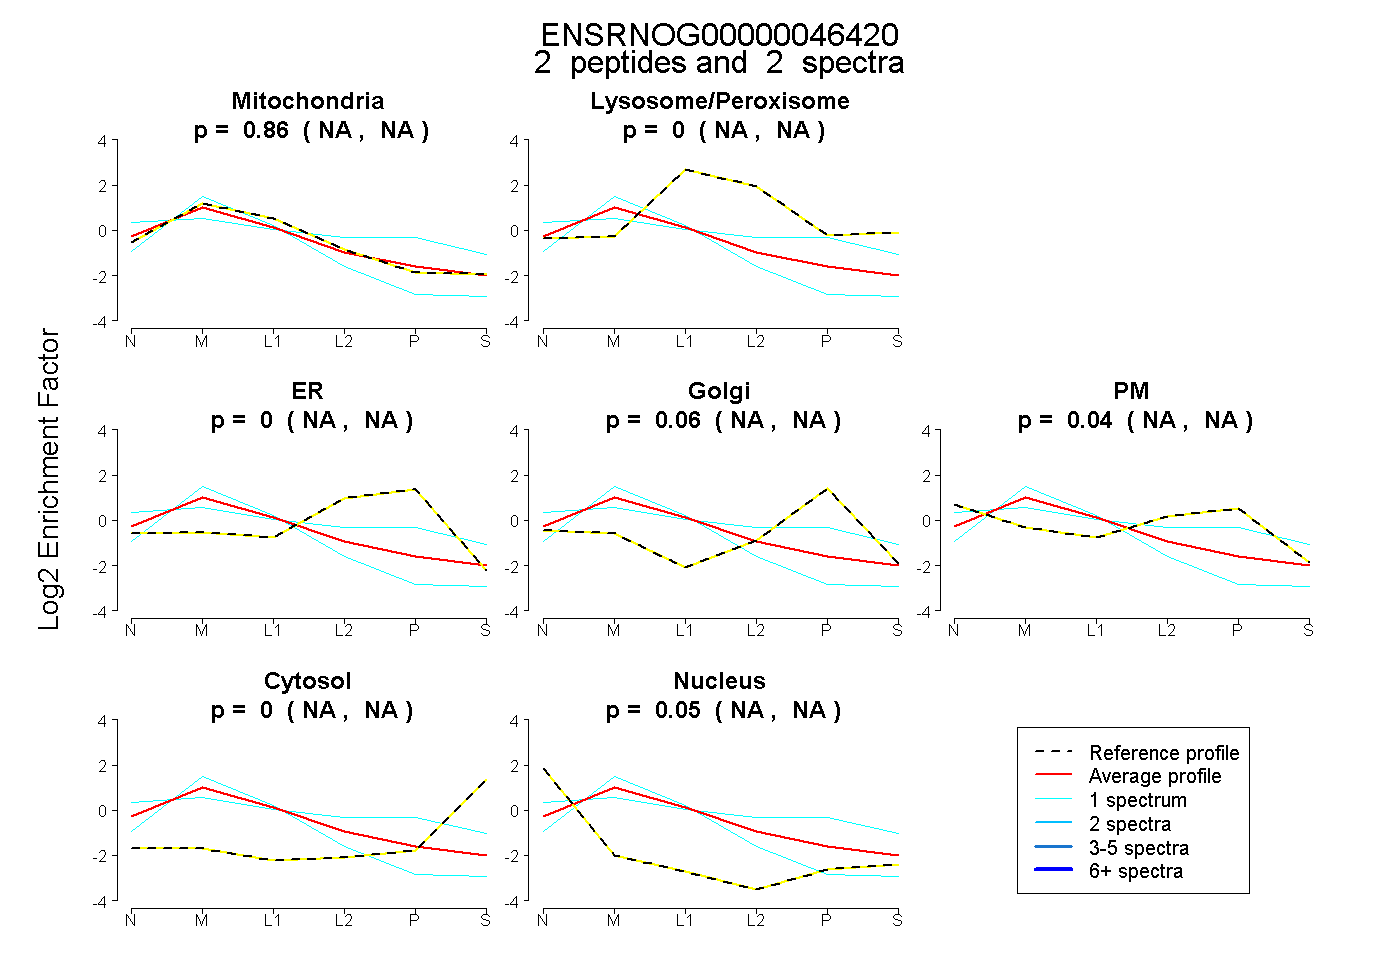 |
0.857 NA | NA |
0.000 NA | NA |
0.000 NA | NA |
0.061 NA | NA |
0.036 NA | NA |
0.000 NA | NA |
0.045 NA | NA |
|||
| Plot | Lyso | Other | |||||||||||
| Expt C |
15 peptides |
55 spectra |
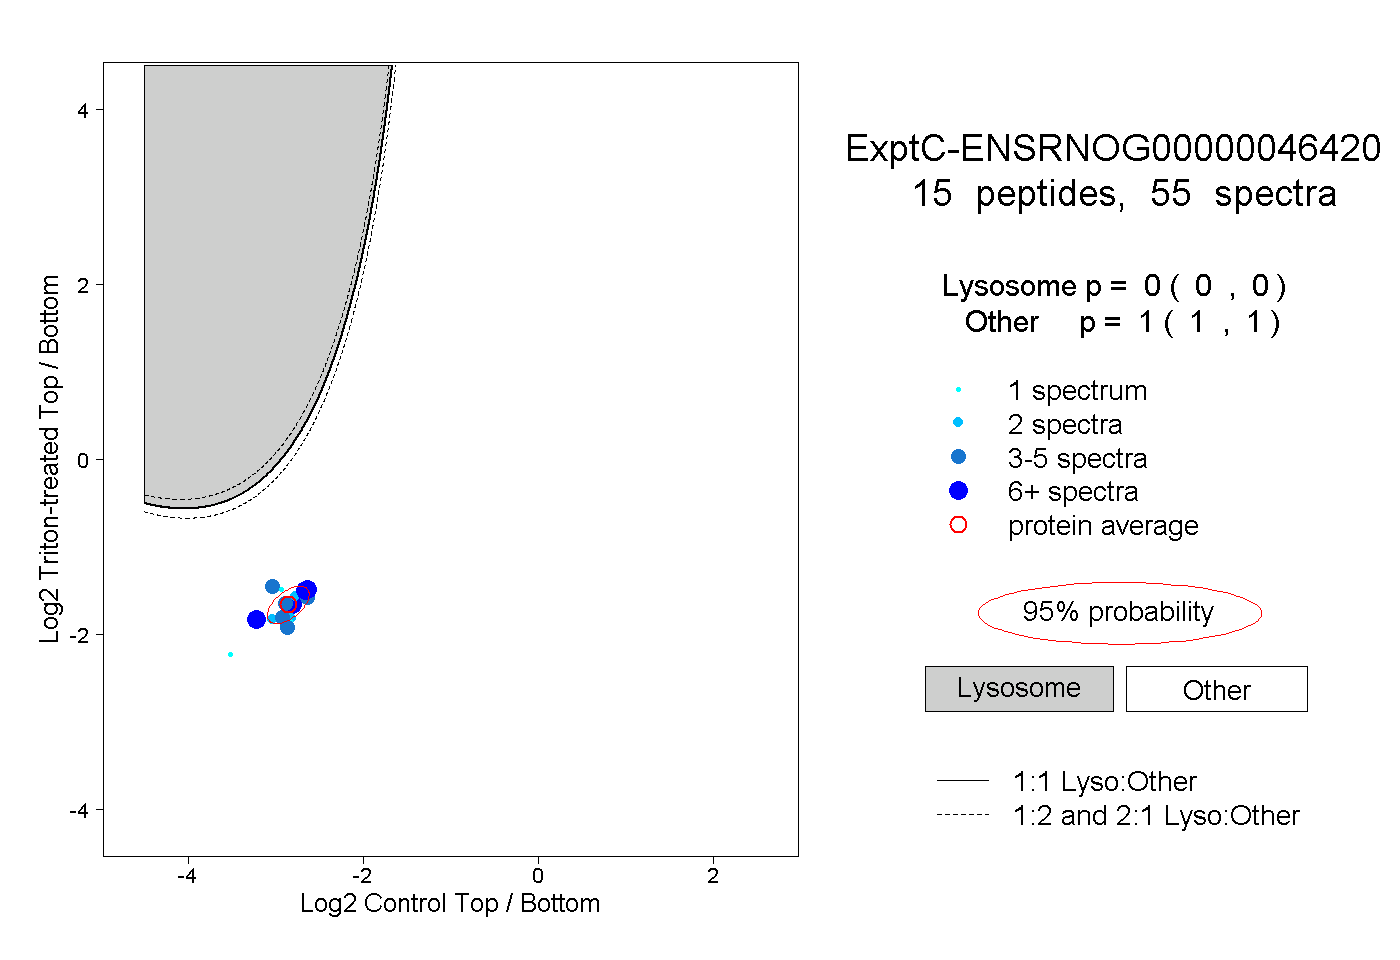 |
0.000 0.000 | 0.000 |
1.000 1.000 | 1.000 |
||||||||
| Plot | Lyso | Other | |||||||||||
| Expt D |
2 peptides |
3 spectra |
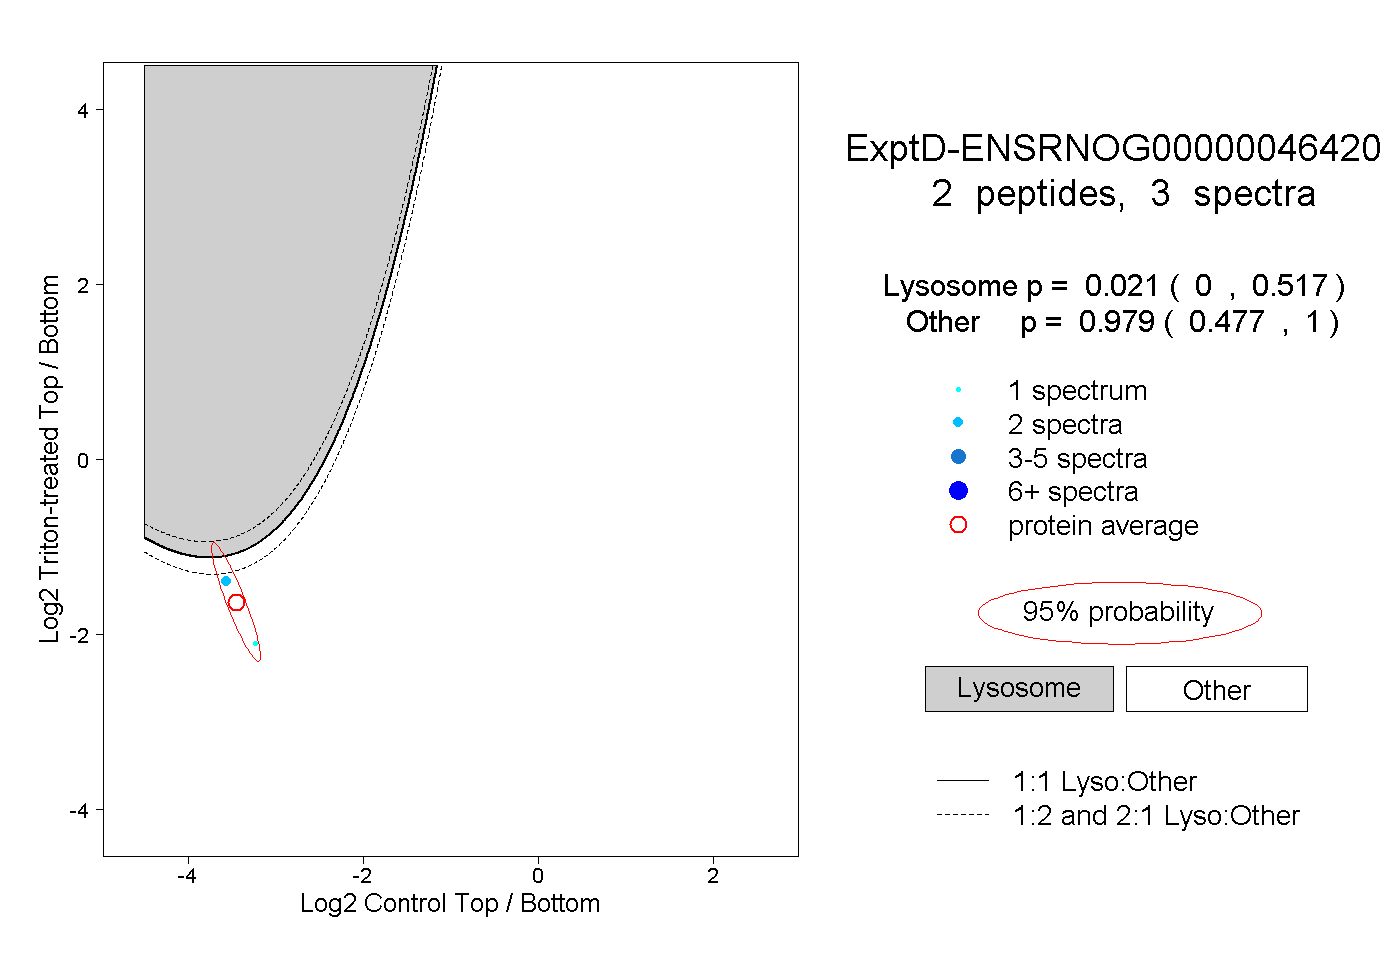 |
0.021 0.000 | 0.517 |
0.979 0.477 | 1.000 |