 6
6peptides
spectra
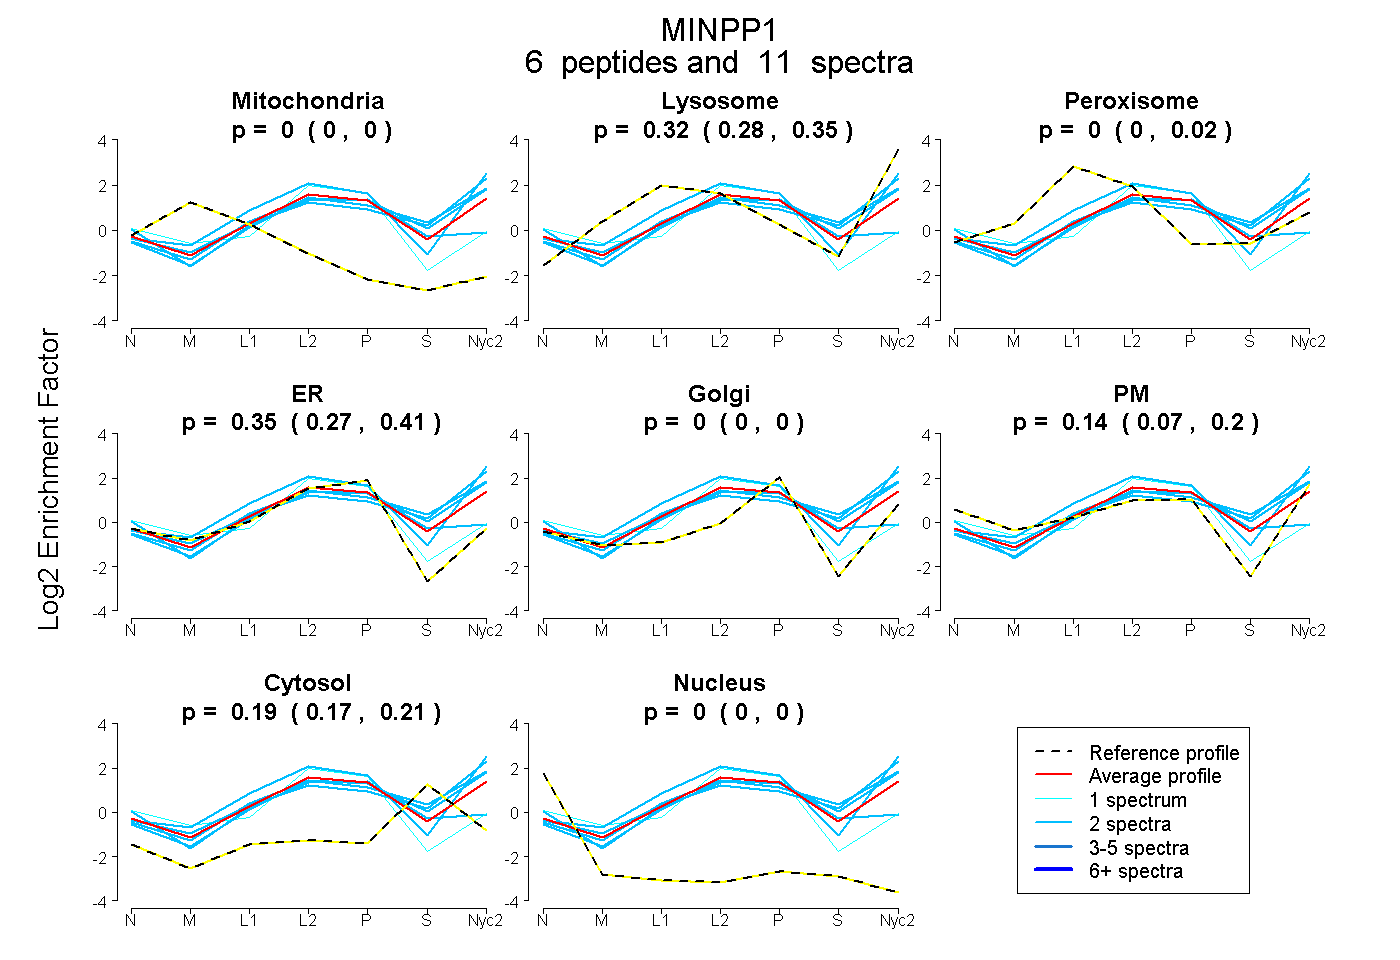
0.000 | 0.000
0.279 | 0.350
0.000 | 0.022
0.267 | 0.407
0.000 | 0.000
0.066 | 0.200
0.167 | 0.209
0.000 | 0.000
1peptide
spectra
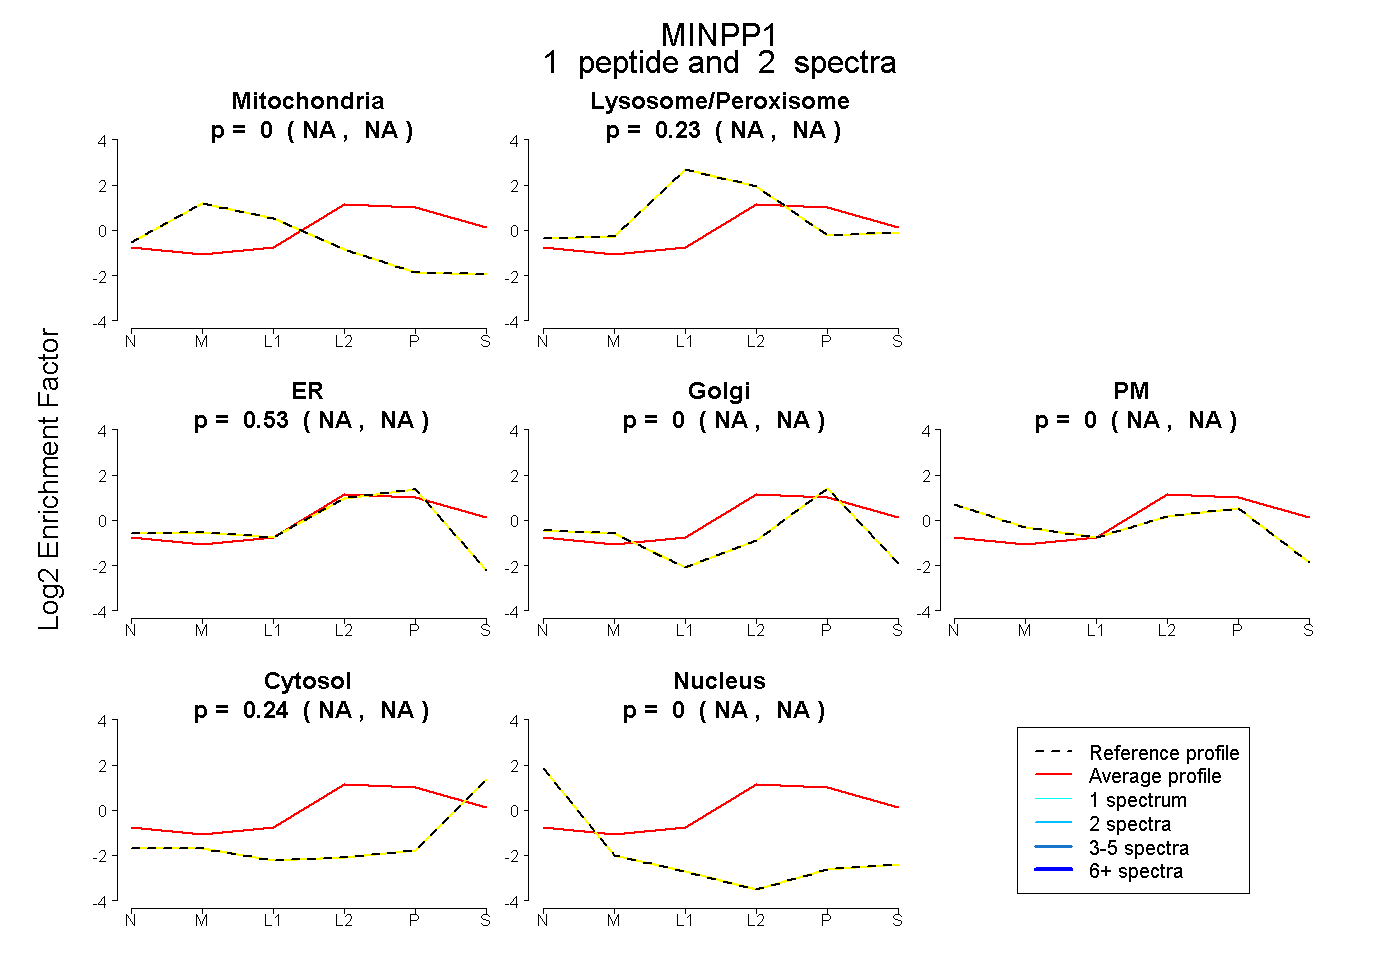
NA | NA
NA | NA
NA | NA
NA | NA
NA | NA
NA | NA
NA | NA
7peptides
spectra
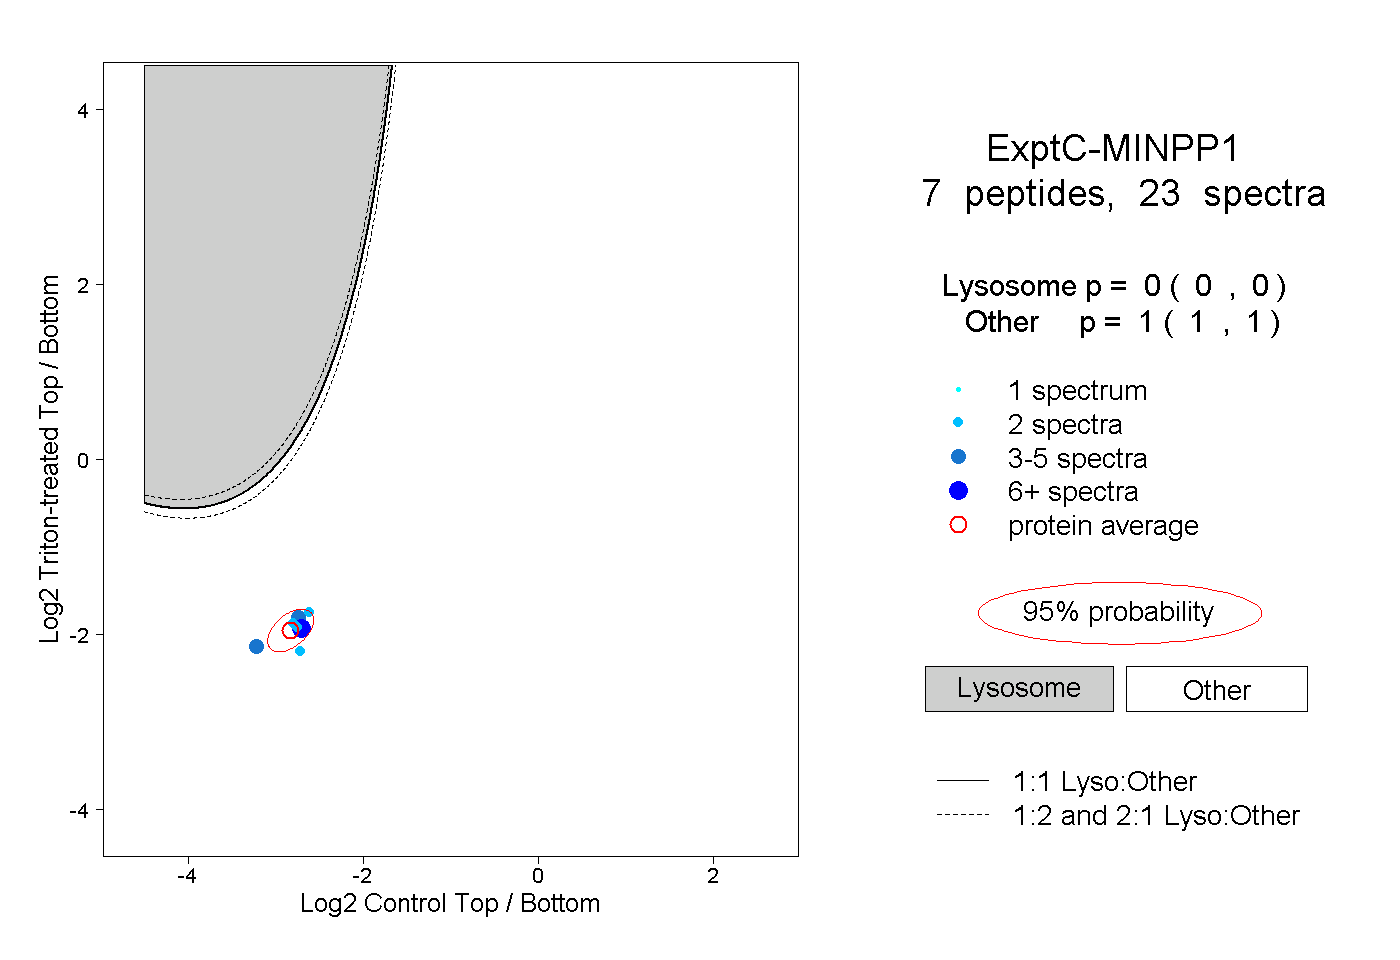
0.000 | 0.000
1.000 | 1.000
2peptides
spectra
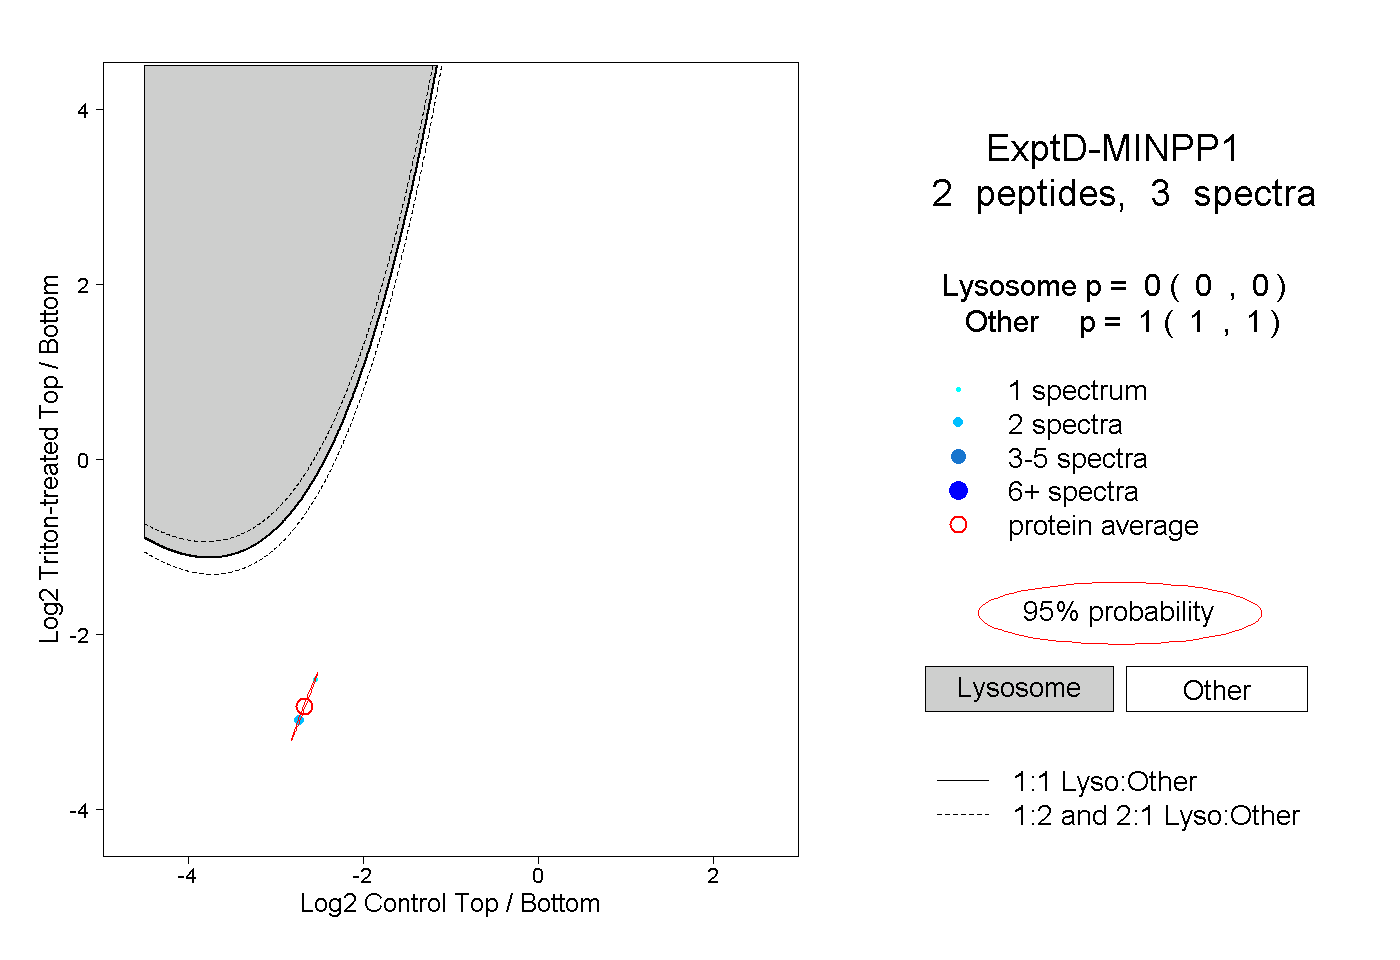
0.000 | 0.000
1.000 | 1.000