 6
6peptides
spectra
0.000 | 0.000
0.279 | 0.350
0.000 | 0.022
0.267 | 0.407
0.000 | 0.000
0.066 | 0.200
0.167 | 0.209
0.000 | 0.000
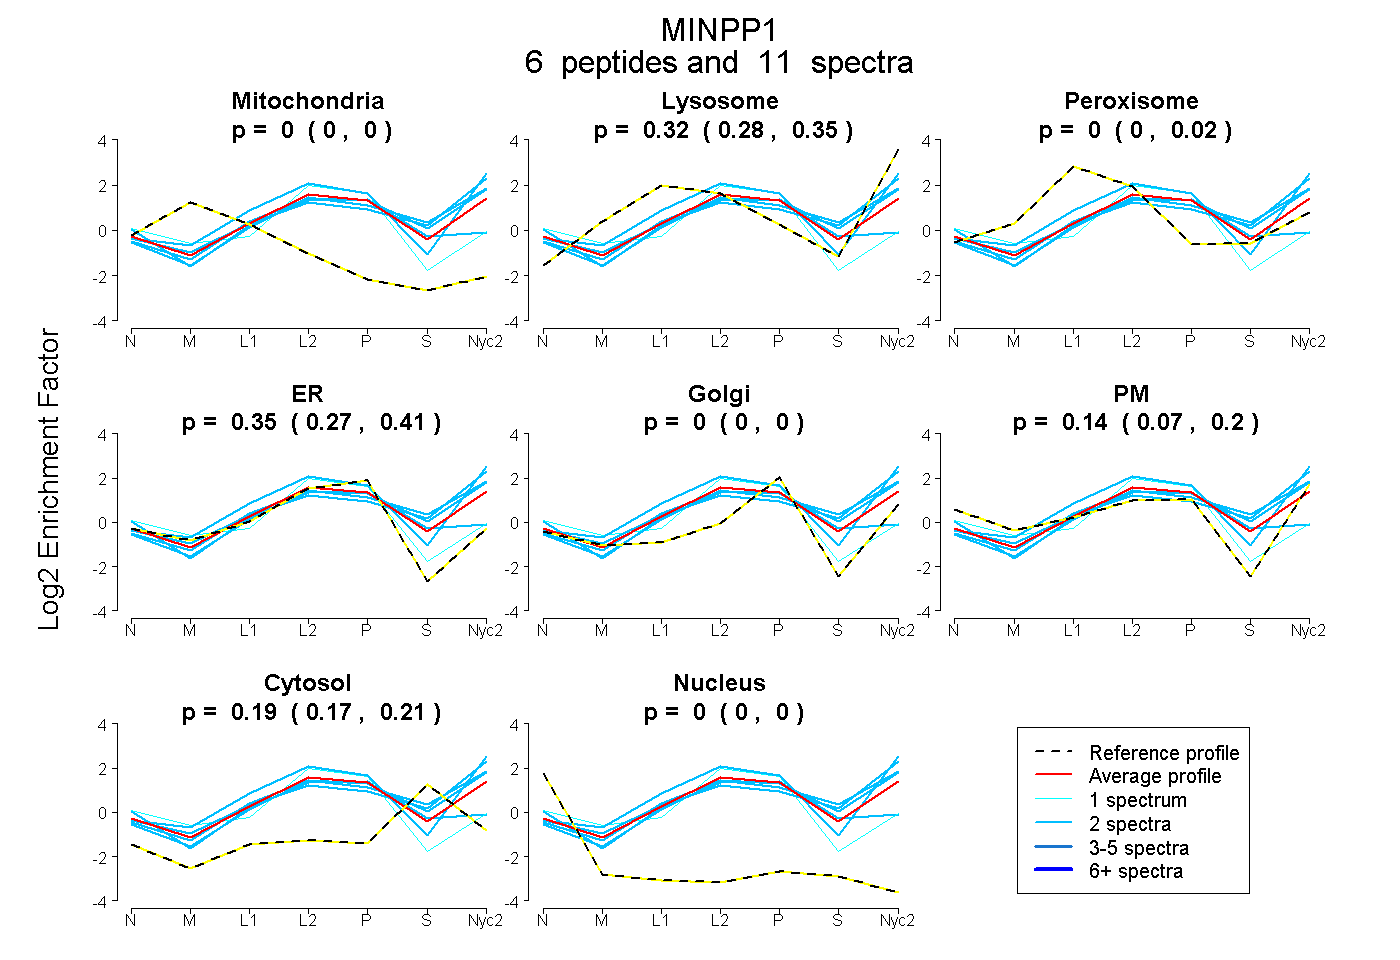
| Plot | Mito | Lyso | Perox | ER | Golgi | PM | Cytosol | Nucleus | |||||
| Expt A |
6 peptides |
11 spectra |
|
0.000 0.000 | 0.000 |
0.323 0.279 | 0.350 |
0.000 0.000 | 0.022 |
0.347 0.267 | 0.407 |
0.000 0.000 | 0.000 |
0.138 0.066 | 0.200 |
0.191 0.167 | 0.209 |
0.000 0.000 | 0.000 |
| 2 spectra, TVALYEDLK | 0.000 | 0.448 | 0.000 | 0.000 | 0.000 | 0.296 | 0.256 | 0.000 | ||
| 2 spectra, FFDHCEK | 0.000 | 0.000 | 0.171 | 0.563 | 0.000 | 0.000 | 0.266 | 0.000 | ||
| 1 spectrum, FQIQMLLNEK | 0.000 | 0.000 | 0.062 | 0.799 | 0.000 | 0.095 | 0.045 | 0.000 | ||
| 2 spectra, VLPLAHSQK | 0.000 | 0.424 | 0.000 | 0.225 | 0.028 | 0.085 | 0.238 | 0.000 | ||
| 2 spectra, VLEYLNDLK | 0.000 | 0.422 | 0.000 | 0.161 | 0.030 | 0.086 | 0.300 | 0.000 | ||
| 2 spectra, QLQGLLQTR | 0.000 | 0.511 | 0.000 | 0.263 | 0.004 | 0.221 | 0.000 | 0.000 |
| Plot | Mito | Lyso or Perox | ER | Golgi | PM | Cytosol | Nucleus | ||||||
| Expt B |
1 peptide |
2 spectra |
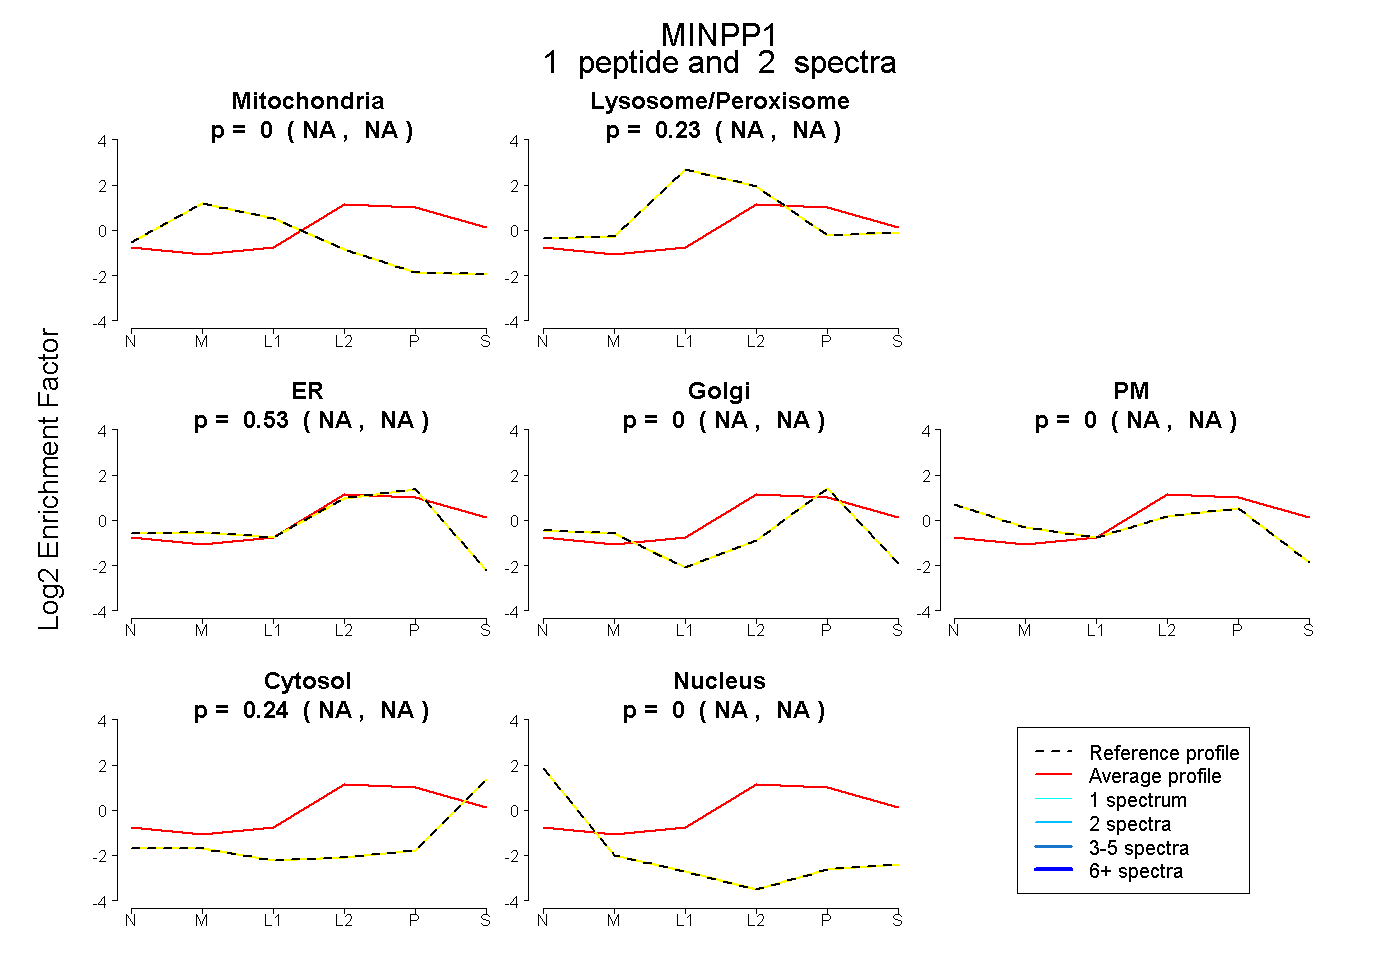 |
0.000 NA | NA |
0.227 NA | NA |
0.533 NA | NA |
0.000 NA | NA |
0.000 NA | NA |
0.240 NA | NA |
0.000 NA | NA |
|||
| Plot | Lyso | Other | |||||||||||
| Expt C |
7 peptides |
23 spectra |
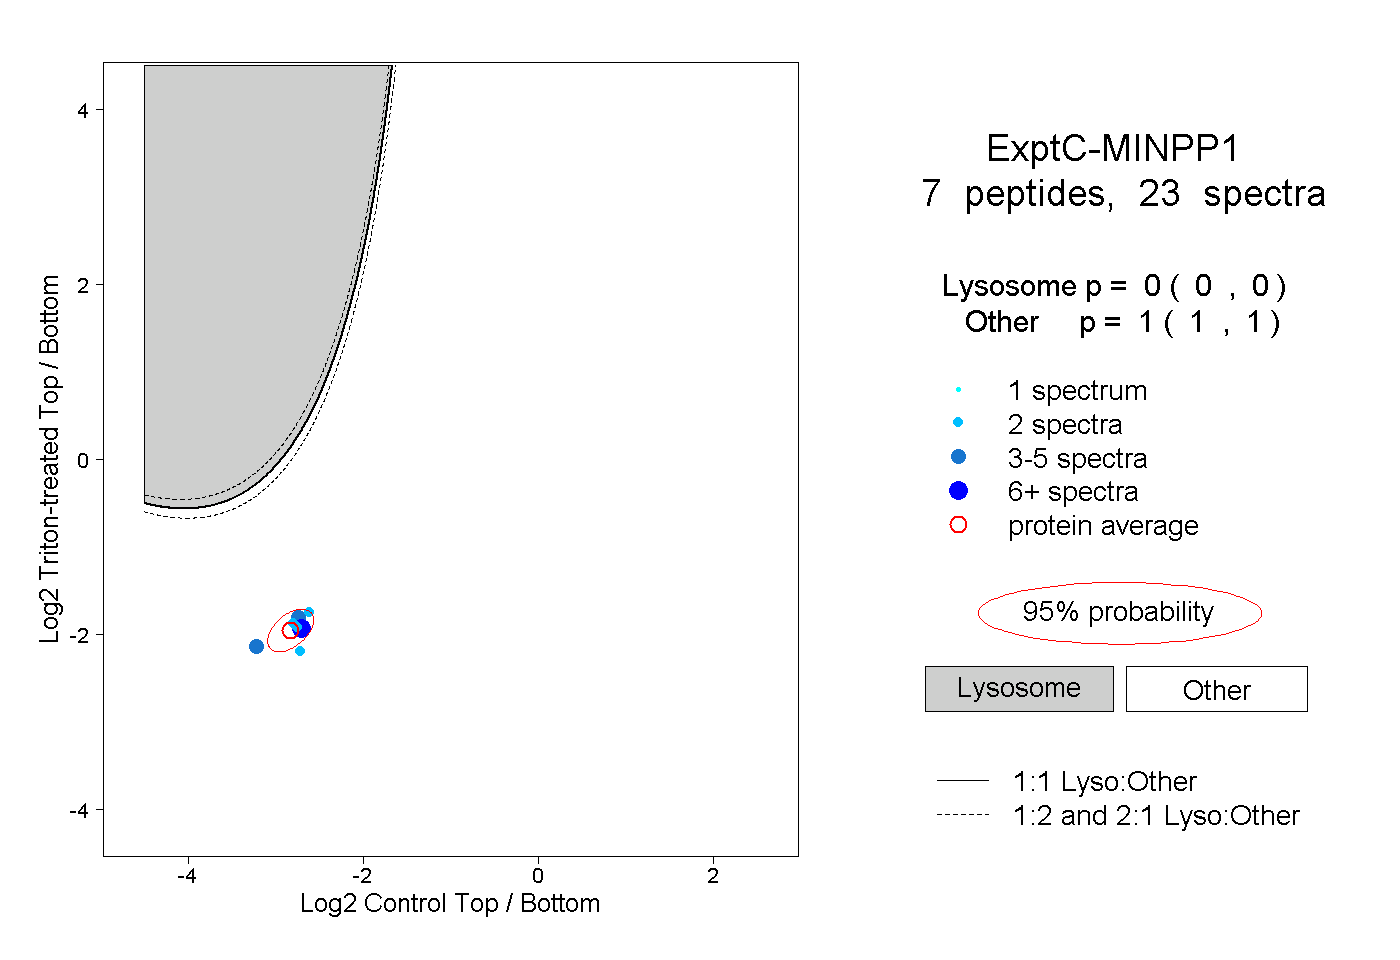 |
0.000 0.000 | 0.000 |
1.000 1.000 | 1.000 |
||||||||
| Plot | Lyso | Other | |||||||||||
| Expt D |
2 peptides |
3 spectra |
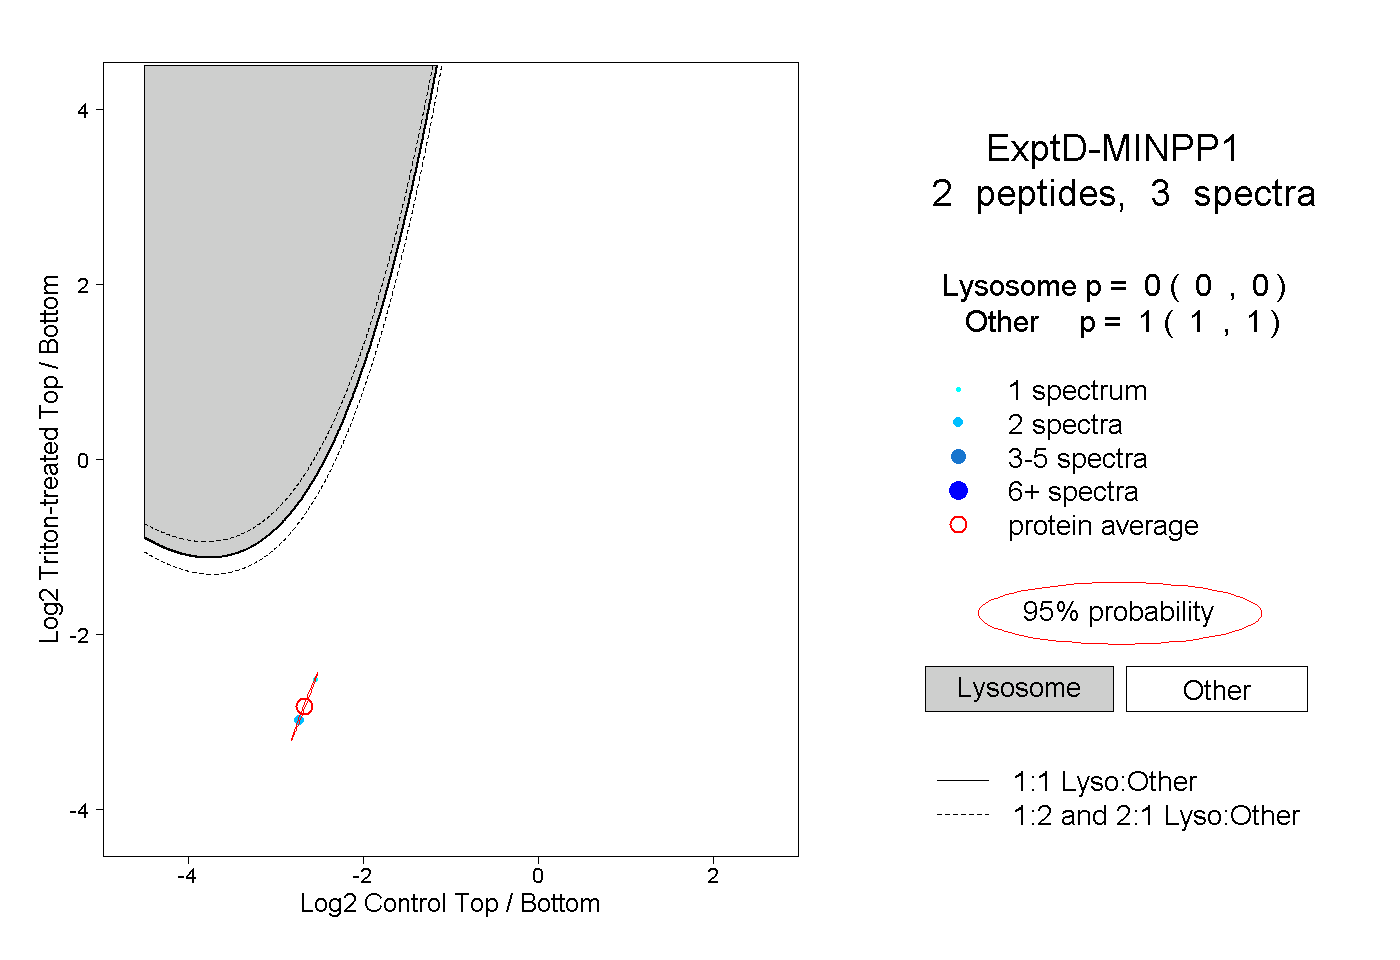 |
0.000 0.000 | 0.000 |
1.000 1.000 | 1.000 |