 35
35peptides
spectra
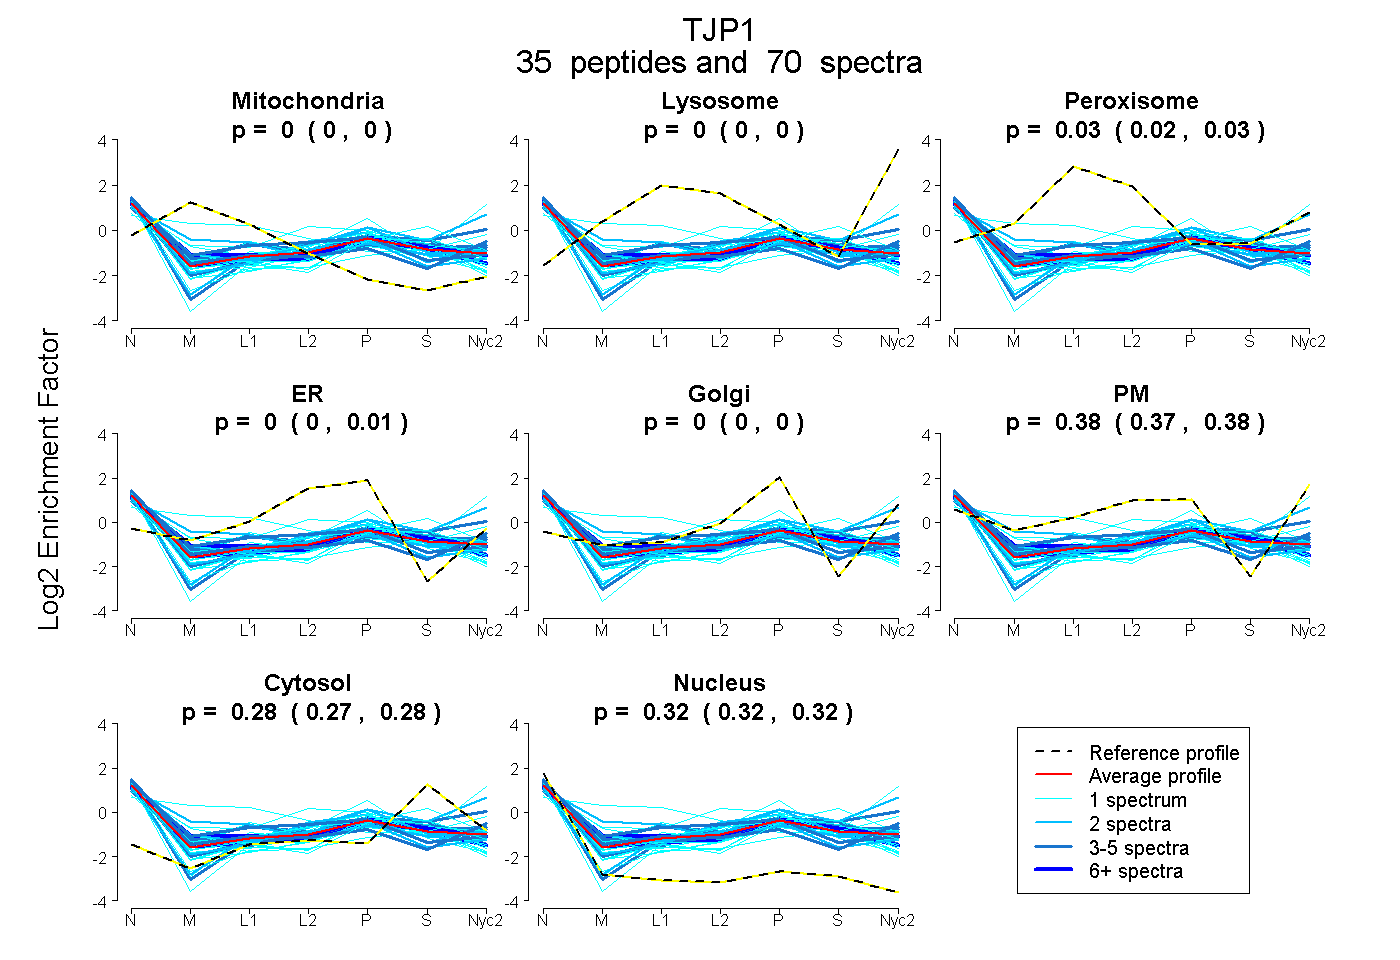
0.000 | 0.000
0.000 | 0.000
0.020 | 0.029
0.000 | 0.008
0.000 | 0.000
0.367 | 0.383
0.273 | 0.281
0.315 | 0.321
7peptides
spectra
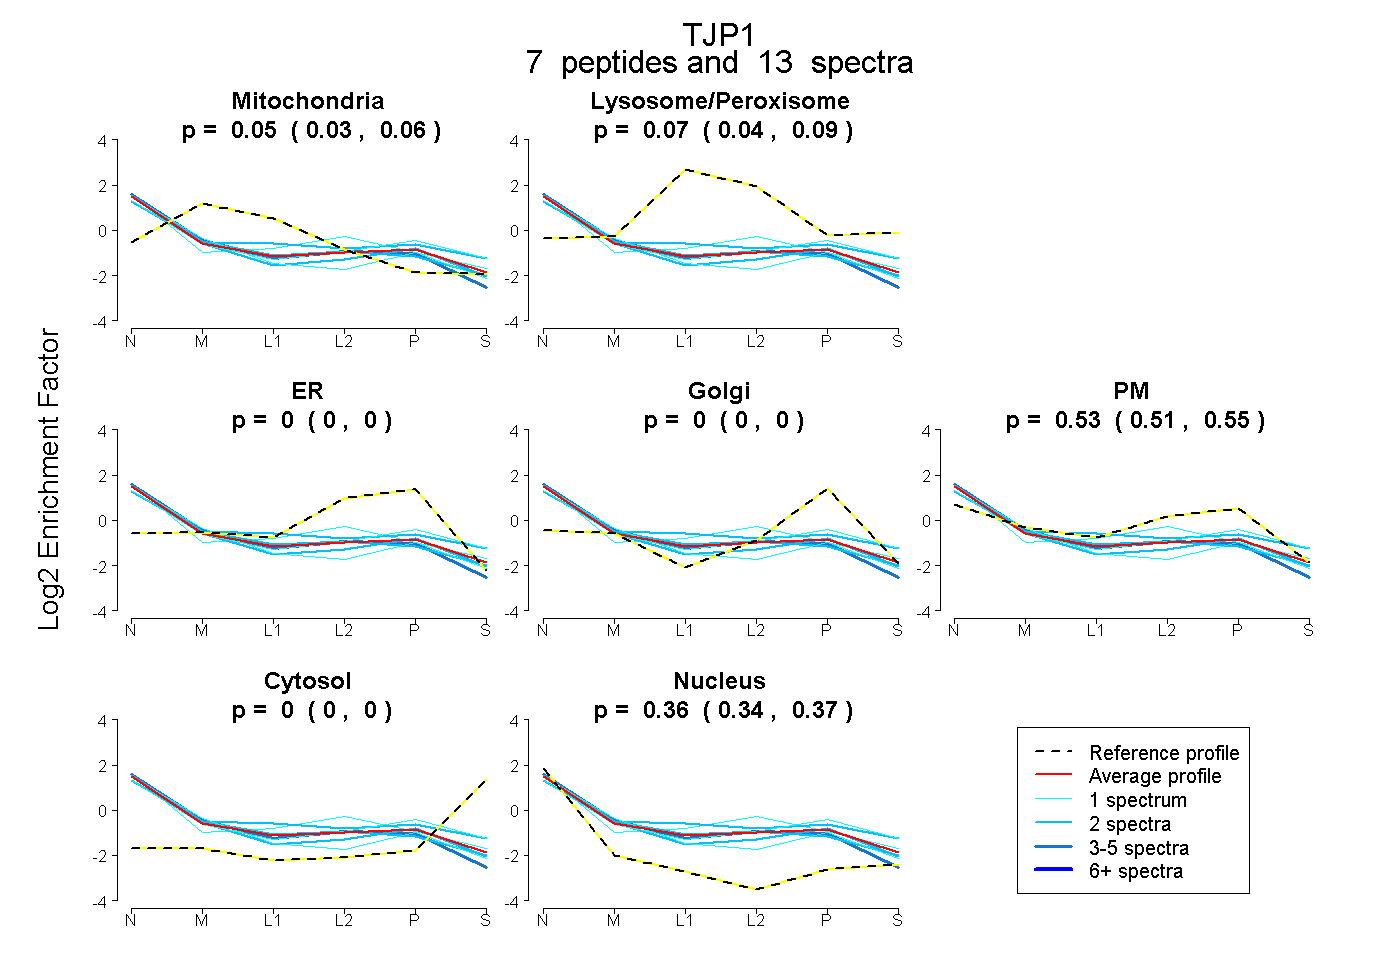
0.027 | 0.062
0.042 | 0.086
0.000 | 0.000
0.000 | 0.000
0.506 | 0.553
0.000 | 0.000
0.344 | 0.369
29peptides
spectra
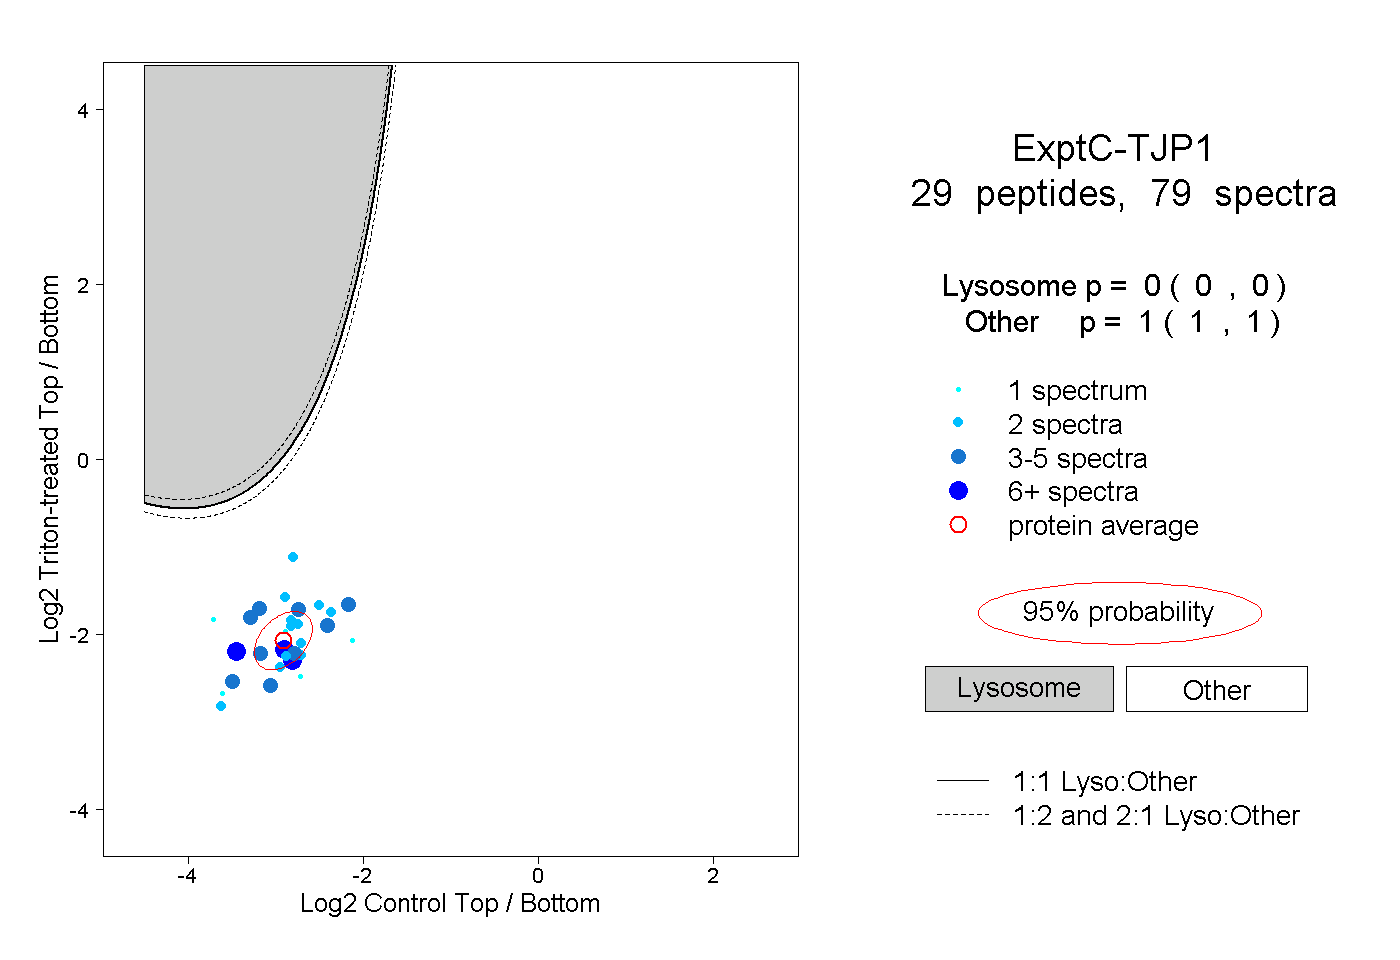
0.000 | 0.000
1.000 | 1.000
5peptides
spectra
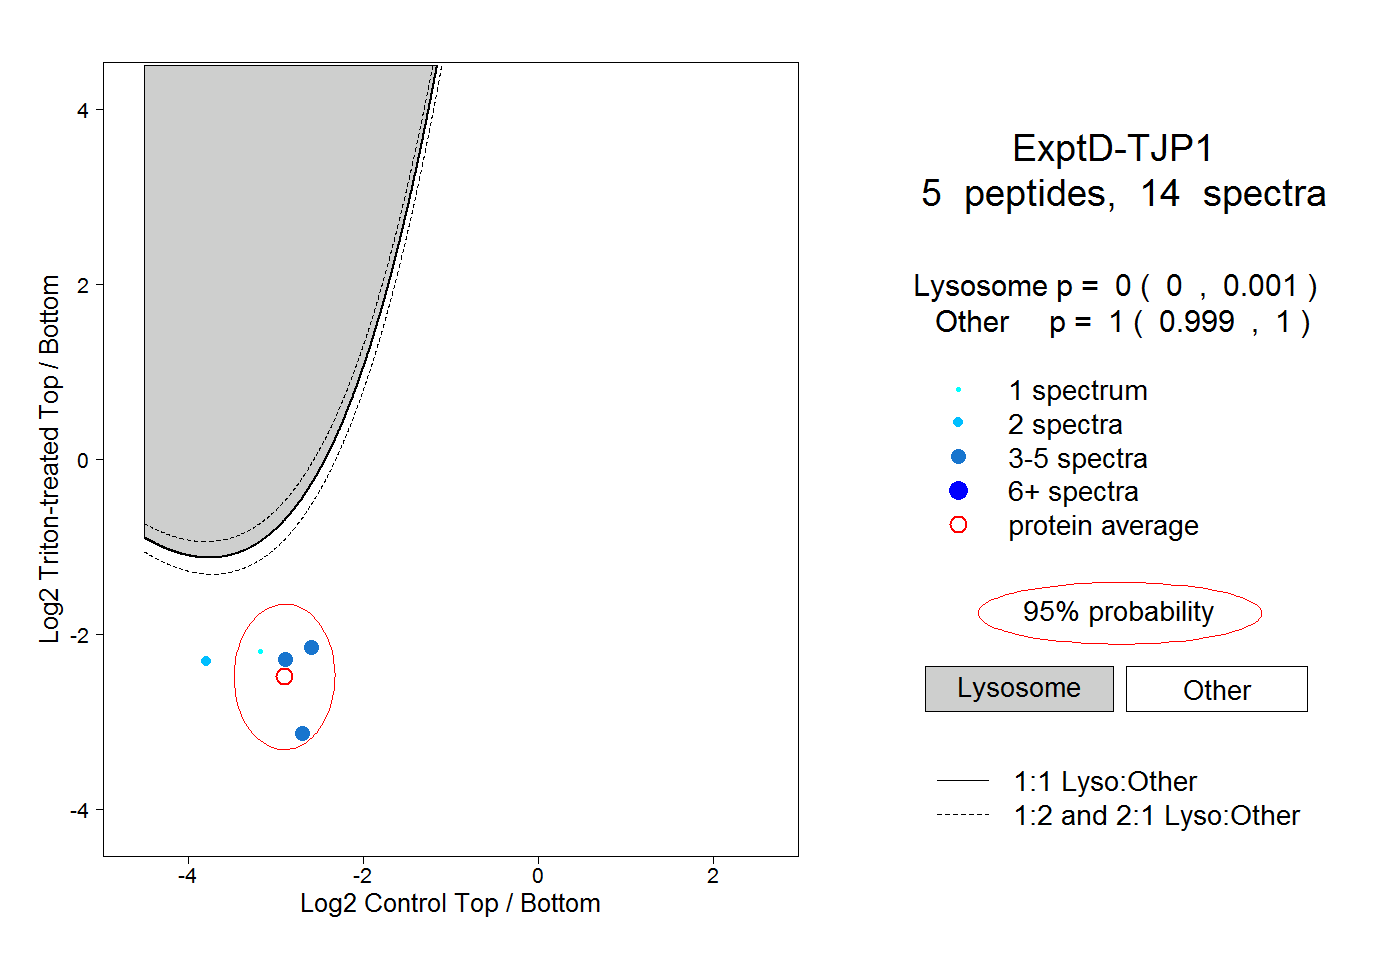
0.000 | 0.001
0.999 | 1.000