 35
35peptides
spectra
0.000 | 0.000
0.000 | 0.000
0.020 | 0.029
0.000 | 0.008
0.000 | 0.000
0.367 | 0.383
0.273 | 0.281
0.315 | 0.321
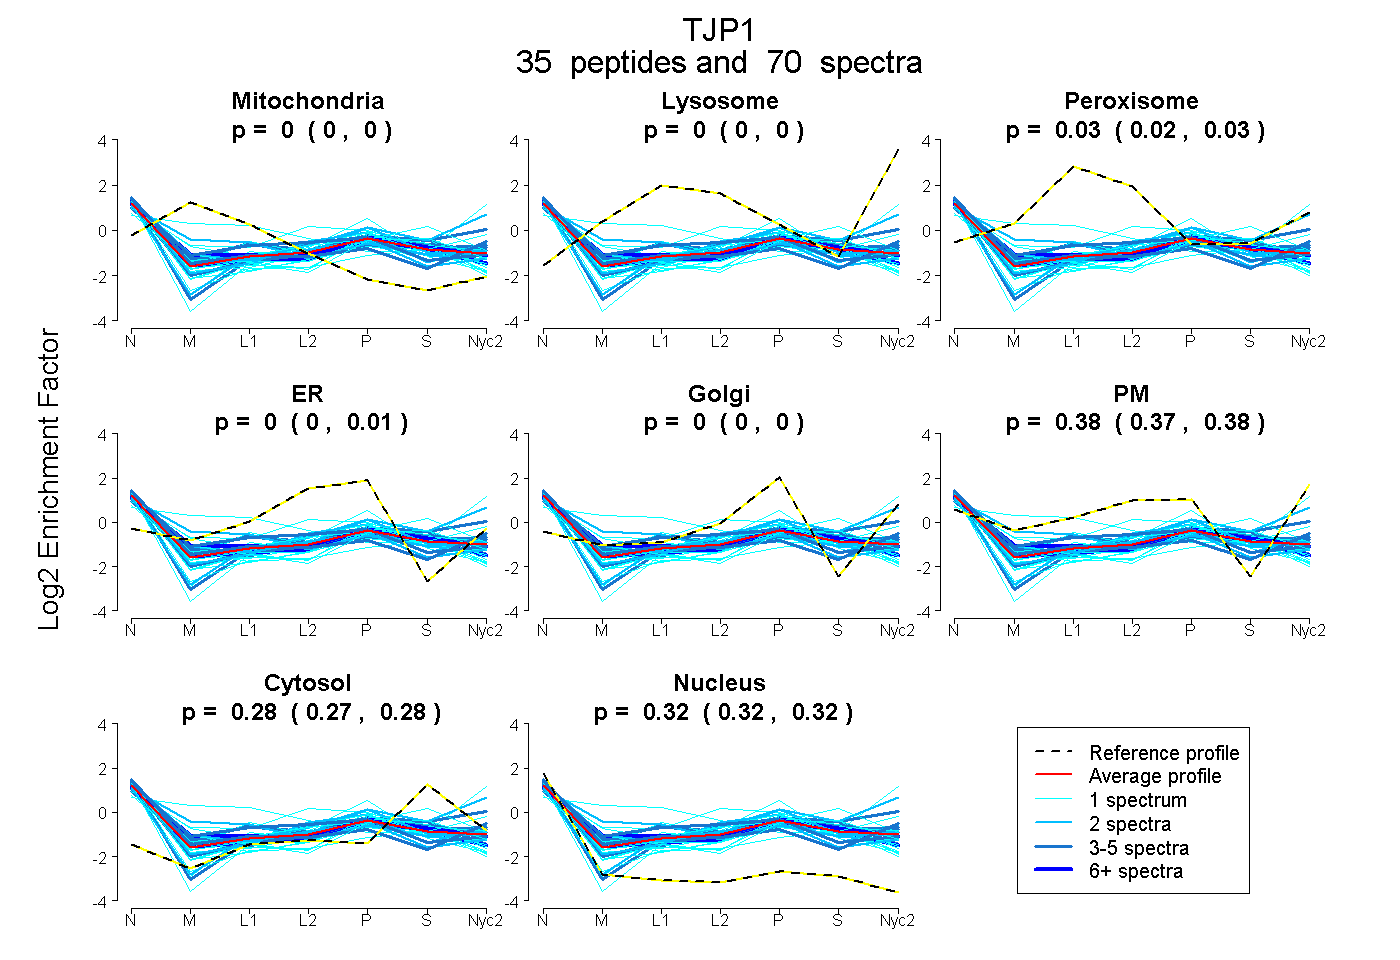
| Plot | Mito | Lyso | Perox | ER | Golgi | PM | Cytosol | Nucleus | |||||
| Expt A |
35 peptides |
70 spectra |
|
0.000 0.000 | 0.000 |
0.000 0.000 | 0.000 |
0.025 0.020 | 0.029 |
0.001 0.000 | 0.008 |
0.000 0.000 | 0.000 |
0.378 0.367 | 0.383 |
0.277 0.273 | 0.281 |
0.318 0.315 | 0.321 |
| 1 spectrum, GGPAEGQLQENDR | 0.000 | 0.000 | 0.000 | 0.456 | 0.019 | 0.000 | 0.192 | 0.333 | ||
| 1 spectrum, YRPEAQPYAPAGPK | 0.000 | 0.000 | 0.000 | 0.000 | 0.121 | 0.078 | 0.438 | 0.364 | ||
| 2 spectra, QPALGHPGQR | 0.000 | 0.000 | 0.000 | 0.183 | 0.000 | 0.284 | 0.248 | 0.285 | ||
| 2 spectra, QHPEEASER | 0.000 | 0.000 | 0.000 | 0.000 | 0.035 | 0.419 | 0.407 | 0.139 | ||
| 1 spectrum, EPYPEEMMR | 0.000 | 0.000 | 0.000 | 0.223 | 0.000 | 0.096 | 0.358 | 0.322 | ||
| 7 spectra, EGLEEGDQILR | 0.000 | 0.000 | 0.036 | 0.069 | 0.000 | 0.254 | 0.264 | 0.377 | ||
| 1 spectrum, EEPDIYQIAK | 0.020 | 0.000 | 0.004 | 0.126 | 0.000 | 0.122 | 0.370 | 0.358 | ||
| 5 spectra, ADGATSDDLDLHDDR | 0.000 | 0.000 | 0.051 | 0.199 | 0.000 | 0.139 | 0.332 | 0.280 | ||
| 4 spectra, VNNVDFTNIIR | 0.000 | 0.000 | 0.187 | 0.085 | 0.000 | 0.277 | 0.084 | 0.368 | ||
| 1 spectrum, HALLDVTPNAVDR | 0.046 | 0.000 | 0.183 | 0.348 | 0.000 | 0.000 | 0.149 | 0.274 | ||
| 2 spectra, QYFDQYPR | 0.214 | 0.000 | 0.053 | 0.000 | 0.000 | 0.326 | 0.186 | 0.221 | ||
| 1 spectrum, QIIDQDK | 0.000 | 0.000 | 0.000 | 0.000 | 0.000 | 0.503 | 0.274 | 0.223 | ||
| 3 spectra, TITPAYNR | 0.000 | 0.000 | 0.034 | 0.000 | 0.000 | 0.455 | 0.114 | 0.397 | ||
| 4 spectra, EISQDSLAAR | 0.000 | 0.000 | 0.115 | 0.000 | 0.000 | 0.370 | 0.243 | 0.272 | ||
| 1 spectrum, EAIQQQQNQLVWVSEGK | 0.000 | 0.000 | 0.000 | 0.025 | 0.000 | 0.393 | 0.176 | 0.406 | ||
| 3 spectra, ESPYGLSFNK | 0.000 | 0.000 | 0.029 | 0.000 | 0.000 | 0.455 | 0.354 | 0.161 | ||
| 1 spectrum, HVDDHTPK | 0.000 | 0.000 | 0.000 | 0.087 | 0.124 | 0.045 | 0.315 | 0.429 | ||
| 3 spectra, AVPVSPSAVEEDEDEDGHTVVATAR | 0.000 | 0.000 | 0.000 | 0.000 | 0.000 | 0.326 | 0.345 | 0.329 | ||
| 1 spectrum, QNHILK | 0.025 | 0.000 | 0.000 | 0.000 | 0.143 | 0.271 | 0.233 | 0.328 | ||
| 2 spectra, LASHIFVK | 0.000 | 0.000 | 0.000 | 0.028 | 0.000 | 0.473 | 0.177 | 0.322 | ||
| 6 spectra, LCPESR | 0.018 | 0.000 | 0.069 | 0.002 | 0.000 | 0.340 | 0.259 | 0.311 | ||
| 1 spectrum, HEEQPTSGYEVHNR | 0.000 | 0.000 | 0.000 | 0.142 | 0.000 | 0.136 | 0.312 | 0.410 | ||
| 2 spectra, LGSWLAIR | 0.020 | 0.000 | 0.050 | 0.057 | 0.000 | 0.367 | 0.099 | 0.407 | ||
| 1 spectrum, AEQLASVQYTLPK | 0.000 | 0.000 | 0.054 | 0.019 | 0.000 | 0.318 | 0.220 | 0.390 | ||
| 1 spectrum, DEGVSLPSHVDPAK | 0.000 | 0.000 | 0.081 | 0.000 | 0.000 | 0.177 | 0.258 | 0.485 | ||
| 1 spectrum, IVESDVGDSFYIR | 0.000 | 0.000 | 0.052 | 0.006 | 0.000 | 0.297 | 0.242 | 0.403 | ||
| 1 spectrum, EEAVLFLLDLPK | 0.186 | 0.329 | 0.045 | 0.000 | 0.000 | 0.207 | 0.108 | 0.125 | ||
| 1 spectrum, GEEVTILAQK | 0.000 | 0.000 | 0.209 | 0.186 | 0.000 | 0.018 | 0.238 | 0.348 | ||
| 3 spectra, FEEPAPLPYDSRPR | 0.000 | 0.000 | 0.000 | 0.000 | 0.000 | 0.354 | 0.342 | 0.304 | ||
| 1 spectrum, DGNIQEGDVVLK | 0.000 | 0.000 | 0.000 | 0.000 | 0.000 | 0.326 | 0.347 | 0.327 | ||
| 1 spectrum, EDPPQTFYPQK | 0.000 | 0.000 | 0.000 | 0.049 | 0.100 | 0.290 | 0.276 | 0.285 | ||
| 1 spectrum, GIVPNK | 0.117 | 0.000 | 0.000 | 0.000 | 0.000 | 0.369 | 0.298 | 0.216 | ||
| 2 spectra, EAGFLRPVTIFGPIADVAR | 0.000 | 0.000 | 0.017 | 0.000 | 0.000 | 0.386 | 0.221 | 0.377 | ||
| 1 spectrum, SHDRPPR | 0.000 | 0.000 | 0.075 | 0.003 | 0.000 | 0.268 | 0.467 | 0.187 | ||
| 1 spectrum, DNSILPPLDK | 0.000 | 0.000 | 0.001 | 0.000 | 0.000 | 0.356 | 0.258 | 0.384 |
| Plot | Mito | Lyso or Perox | ER | Golgi | PM | Cytosol | Nucleus | ||||||
| Expt B |
7 peptides |
13 spectra |
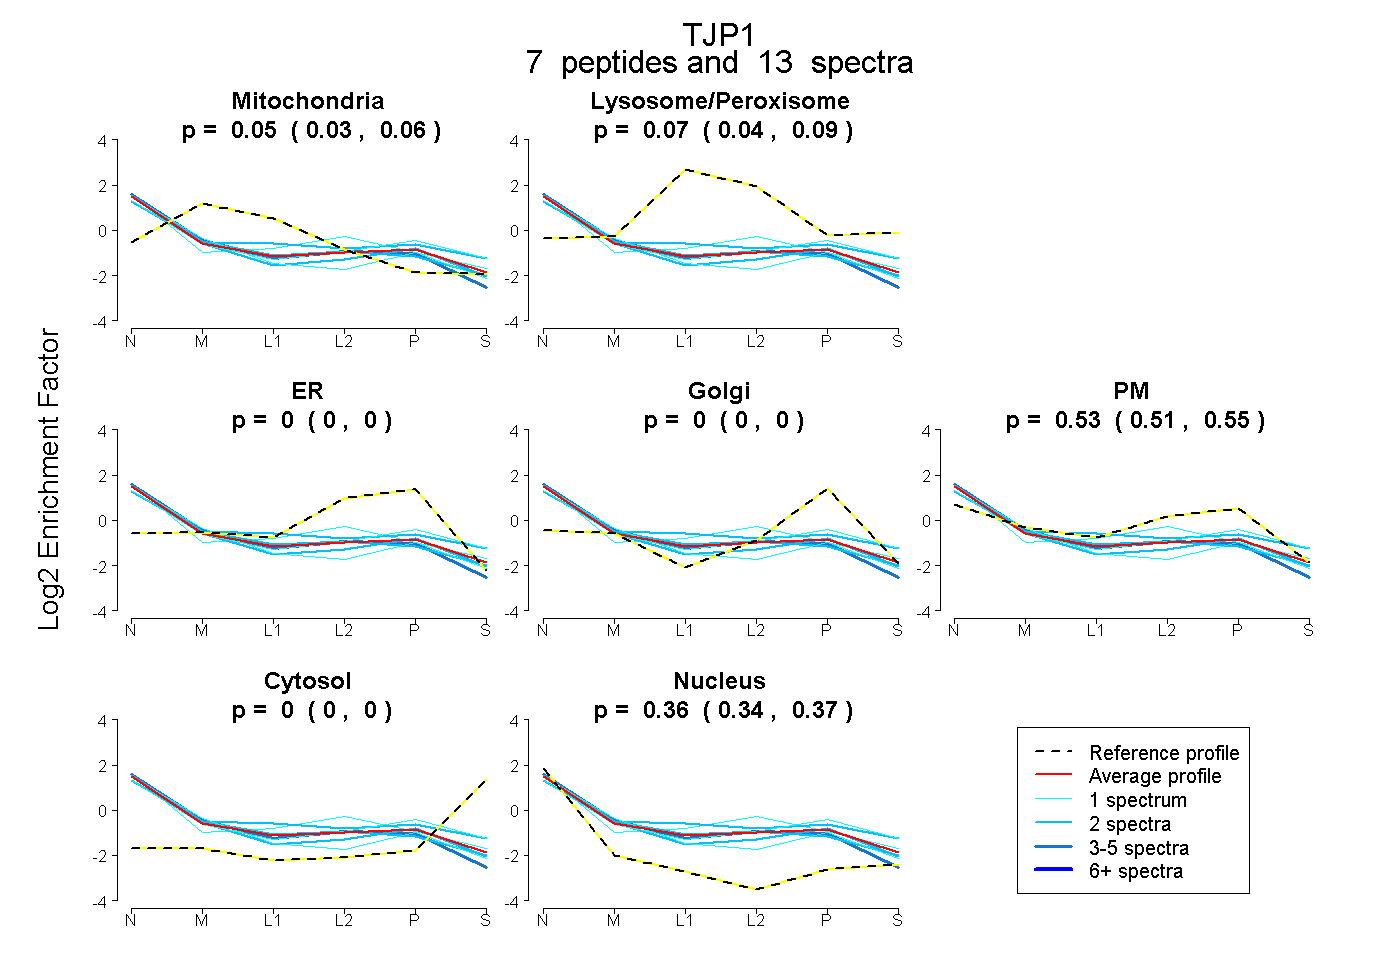 |
0.046 0.027 | 0.062 |
0.065 0.042 | 0.086 |
0.000 0.000 | 0.000 |
0.000 0.000 | 0.000 |
0.531 0.506 | 0.553 |
0.000 0.000 | 0.000 |
0.358 0.344 | 0.369 |
|||
| Plot | Lyso | Other | |||||||||||
| Expt C |
29 peptides |
79 spectra |
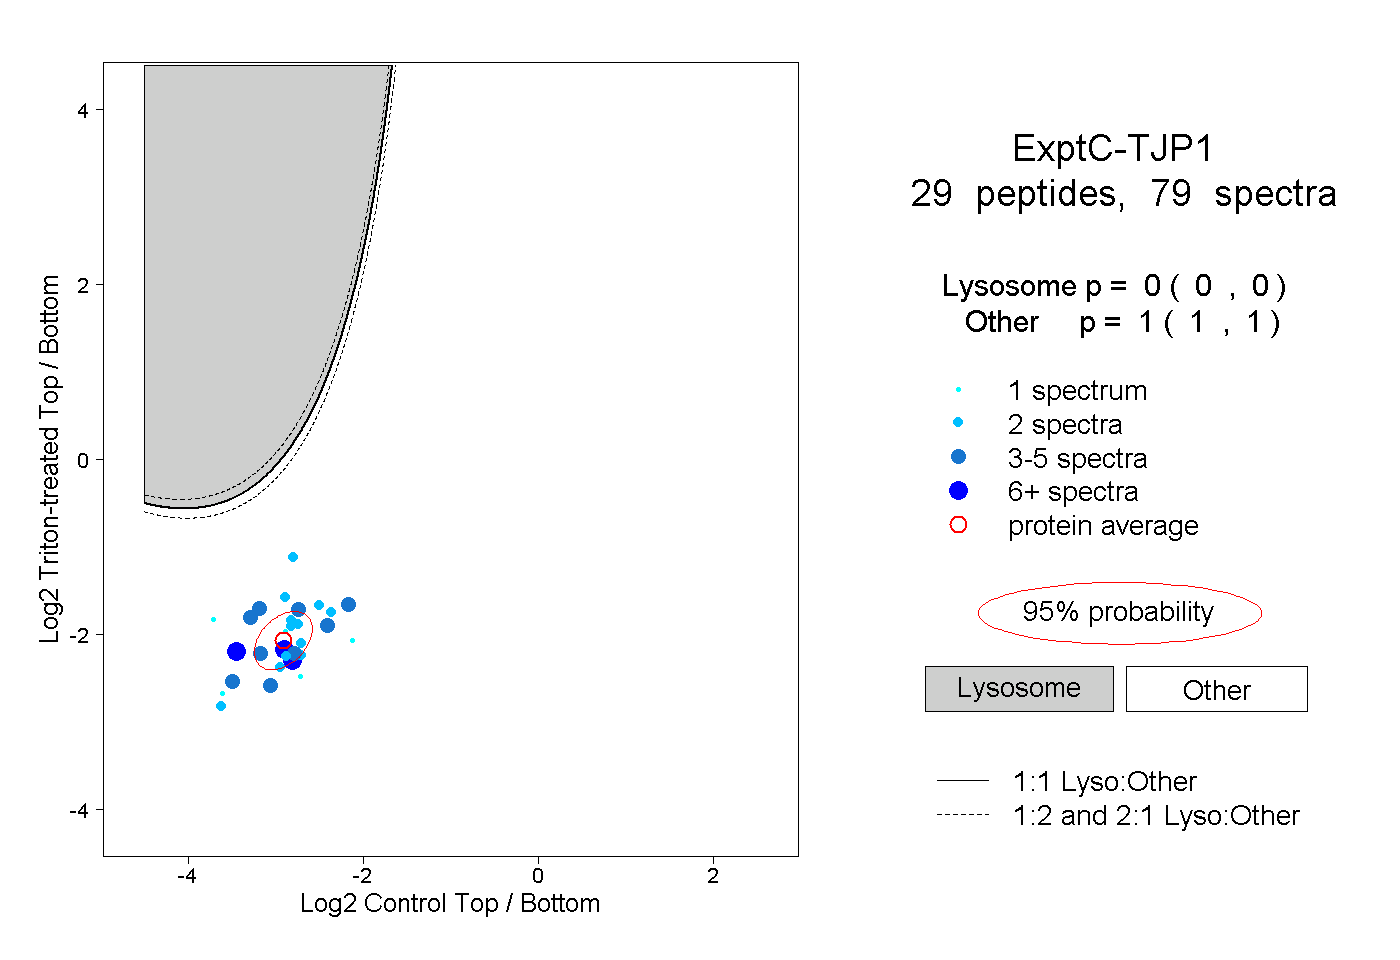 |
0.000 0.000 | 0.000 |
1.000 1.000 | 1.000 |
||||||||
| Plot | Lyso | Other | |||||||||||
| Expt D |
5 peptides |
14 spectra |
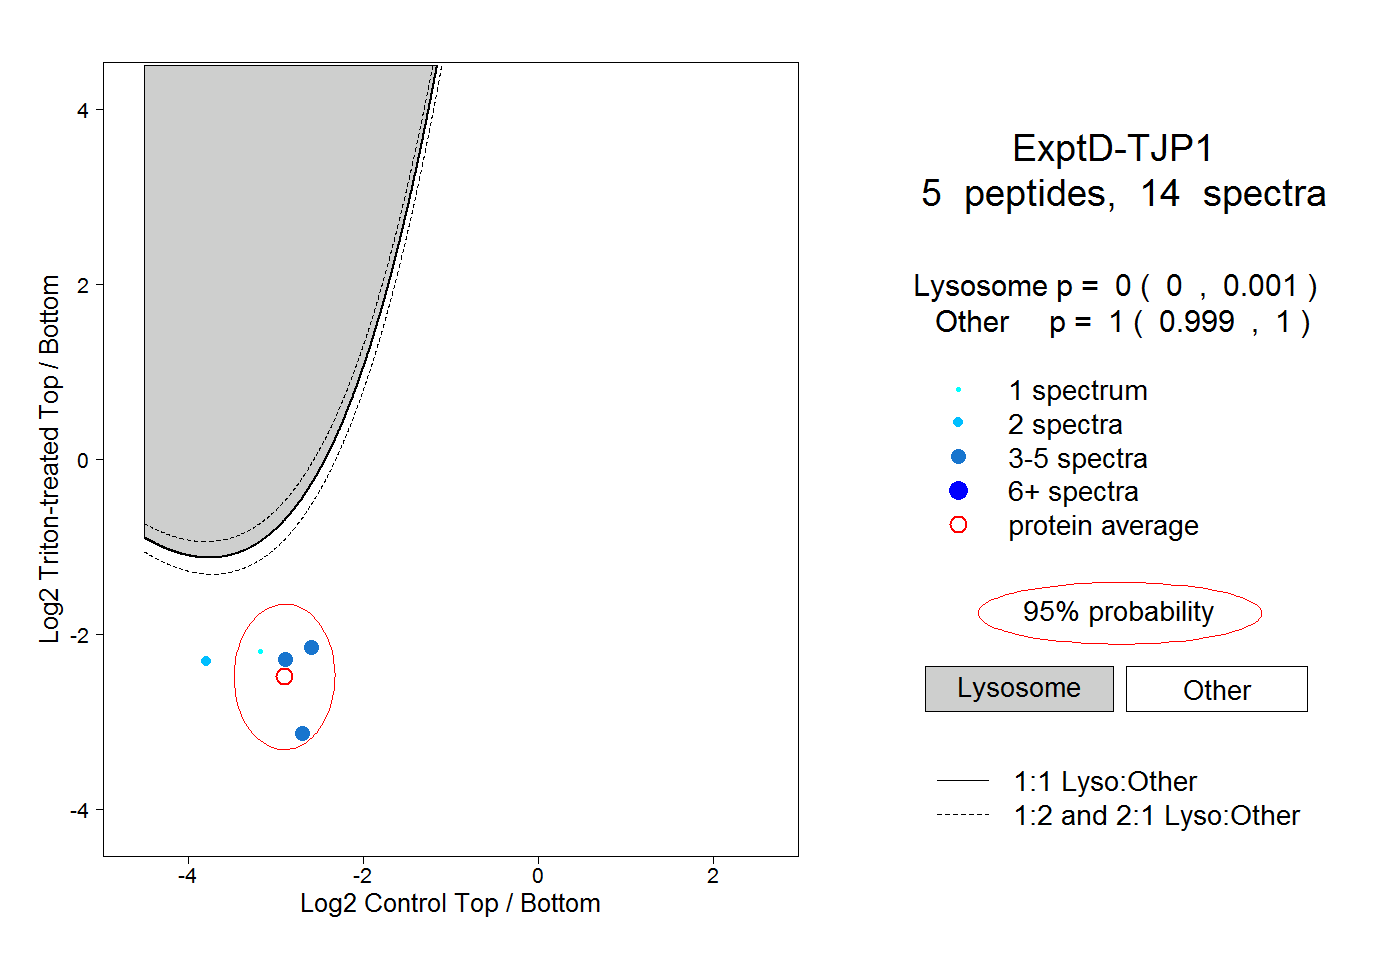 |
0.000 0.000 | 0.001 |
1.000 0.999 | 1.000 |