 5
5peptides
spectra
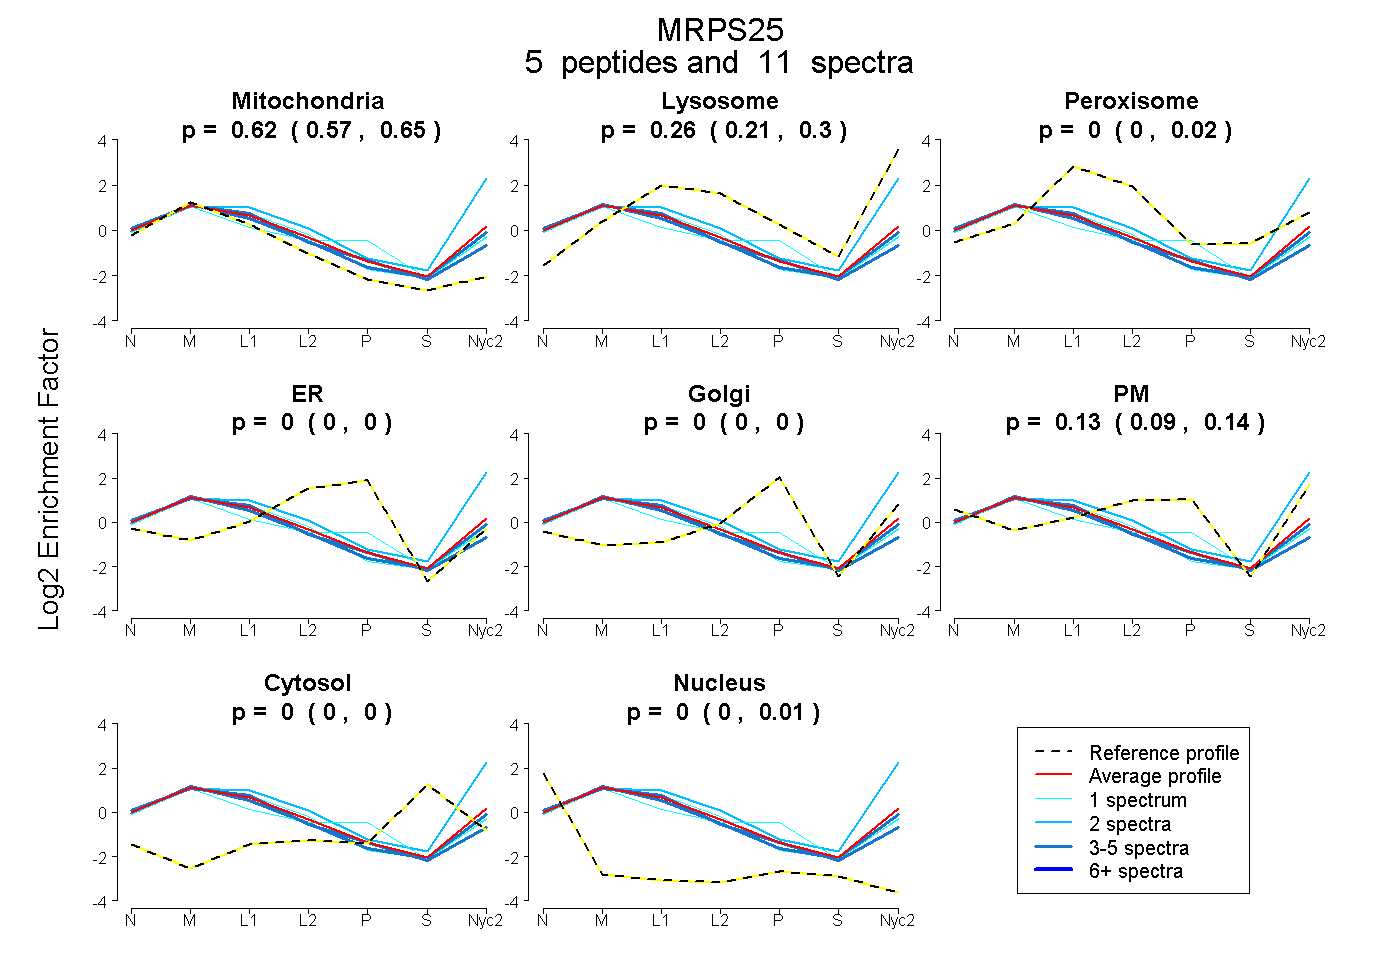
0.574 | 0.645
0.206 | 0.298
0.000 | 0.015
0.000 | 0.000
0.000 | 0.000
0.090 | 0.143
0.000 | 0.000
0.000 | 0.014
3peptides
spectra
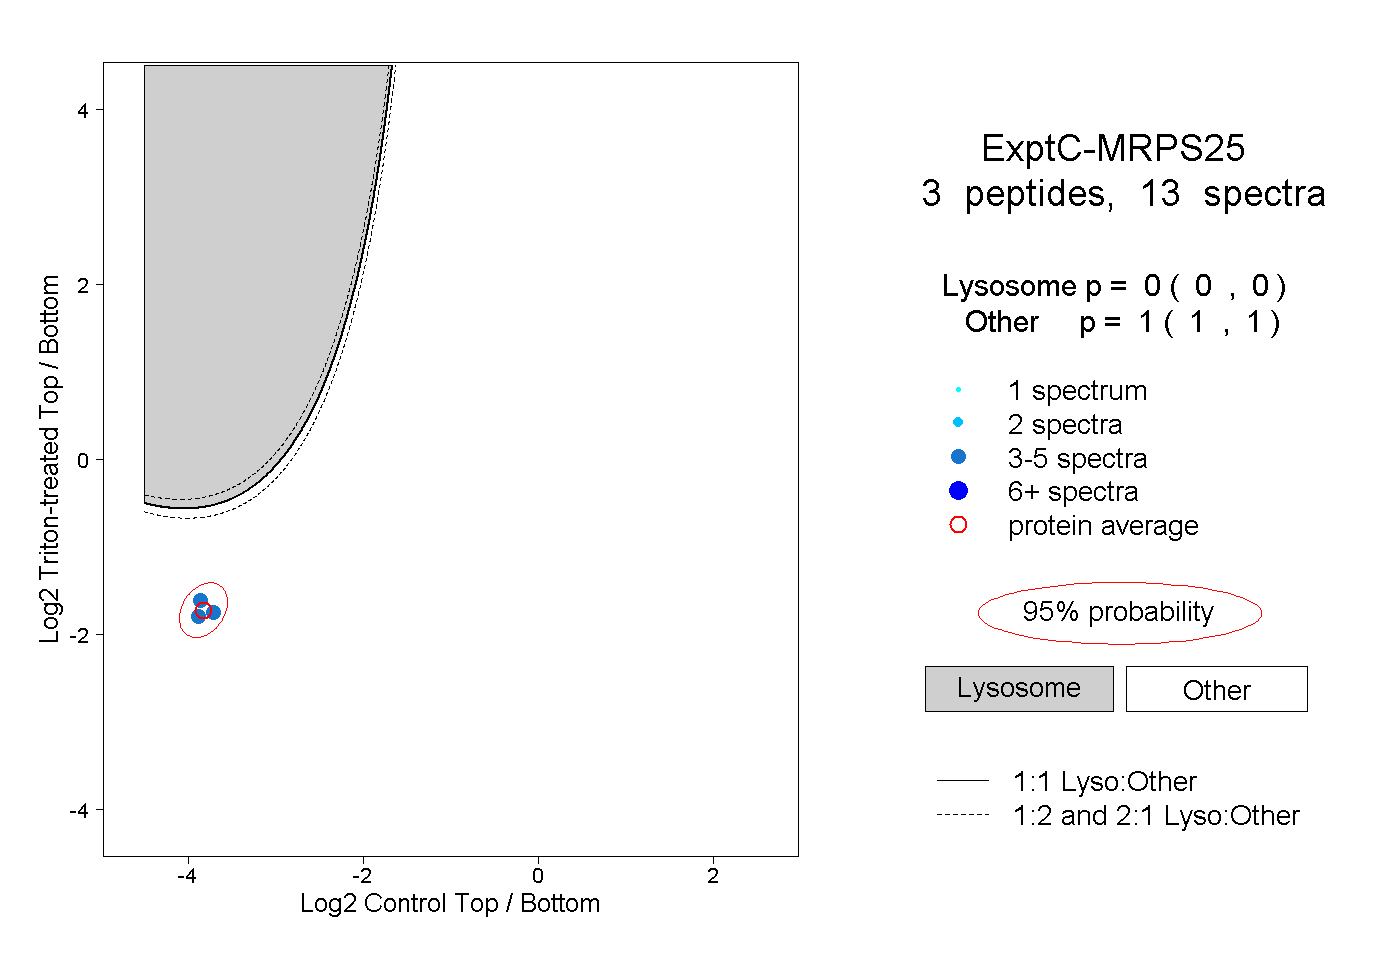
0.000 | 0.000
1.000 | 1.000
1peptide
spectra
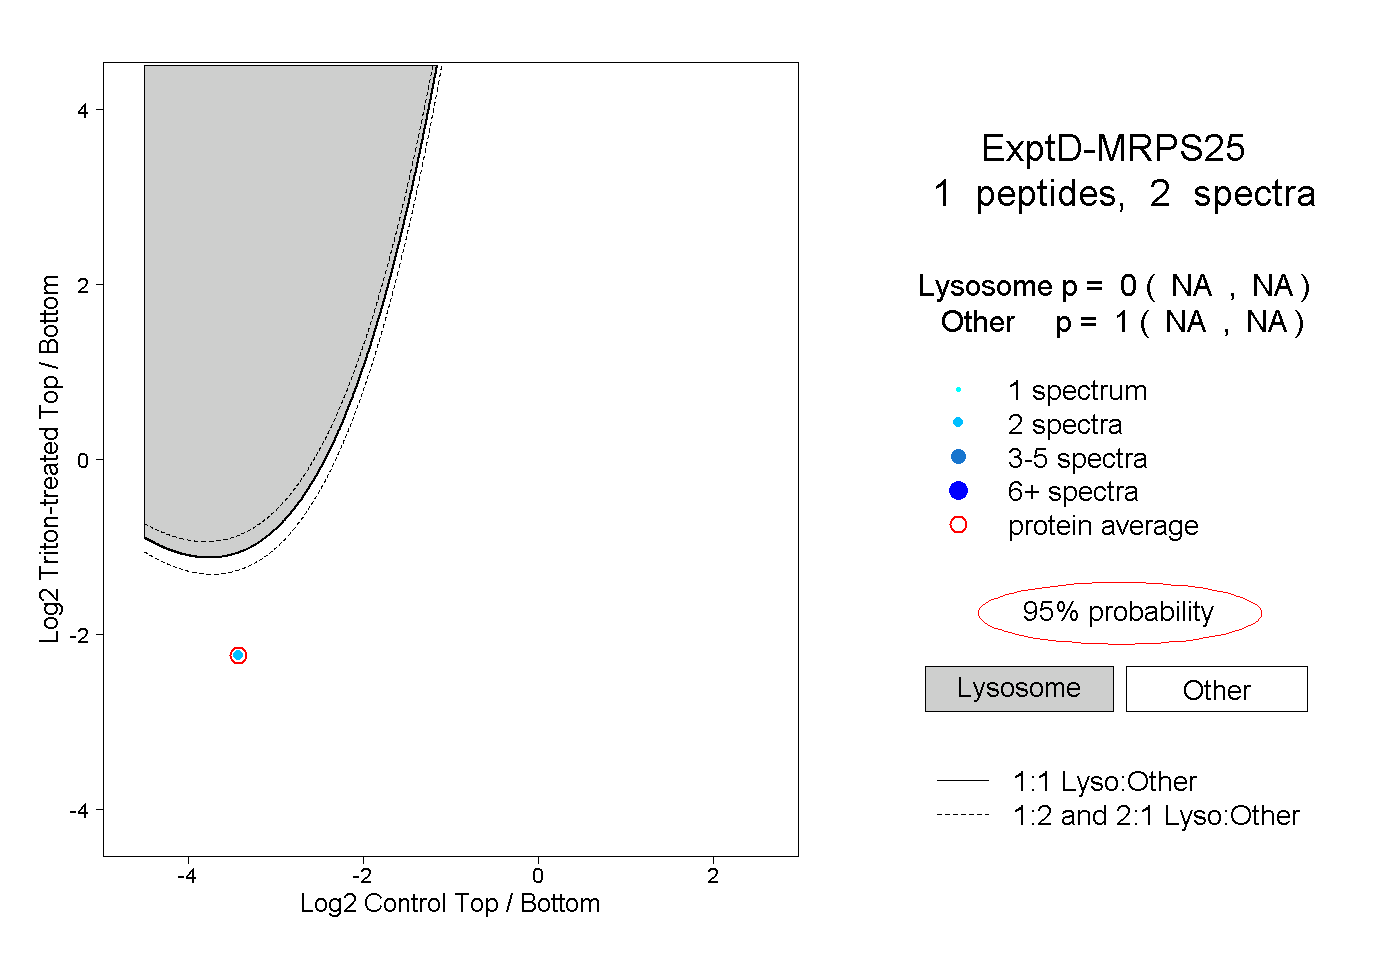
NA | NA
NA | NA