 5
5peptides
spectra
0.574 | 0.645
0.206 | 0.298
0.000 | 0.015
0.000 | 0.000
0.000 | 0.000
0.090 | 0.143
0.000 | 0.000
0.000 | 0.014
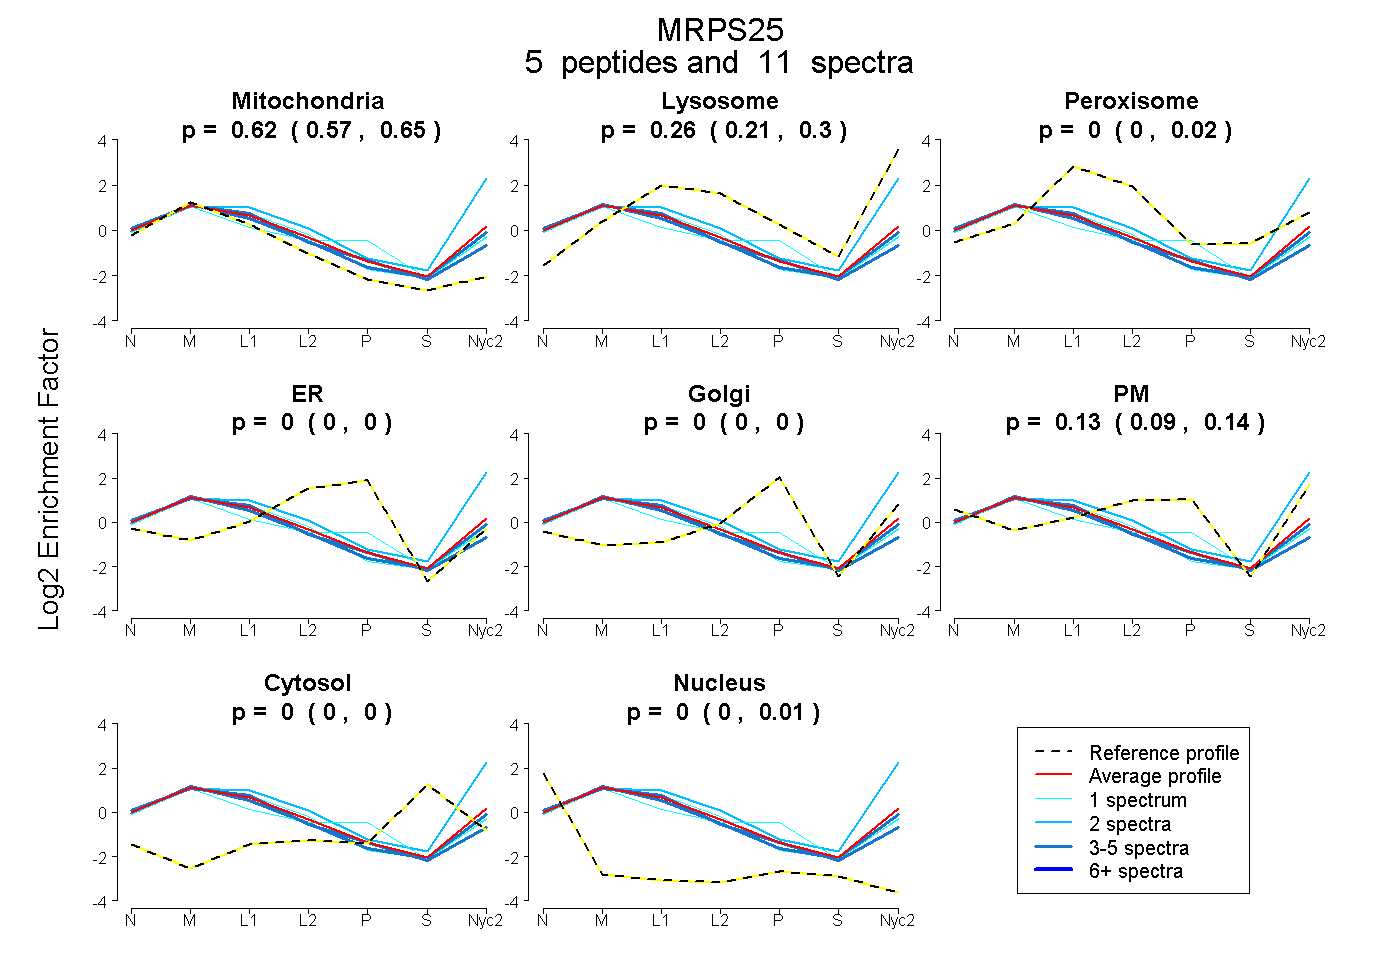
| Plot | Mito | Lyso | Perox | ER | Golgi | PM | Cytosol | Nucleus | |||||
| Expt A |
5 peptides |
11 spectra |
|
0.619 0.574 | 0.645 |
0.255 0.206 | 0.298 |
0.000 0.000 | 0.015 |
0.000 0.000 | 0.000 |
0.000 0.000 | 0.000 |
0.125 0.090 | 0.143 |
0.000 0.000 | 0.000 |
0.000 0.000 | 0.014 |
| 1 spectrum, TLQYLGSGDVVFK | 0.564 | 0.104 | 0.000 | 0.000 | 0.151 | 0.181 | 0.000 | 0.000 | ||
| 4 spectra, NMTPSPFLR | 0.667 | 0.262 | 0.000 | 0.000 | 0.000 | 0.047 | 0.000 | 0.024 | ||
| 1 spectrum, FHPGNFGPR | 0.662 | 0.131 | 0.115 | 0.000 | 0.000 | 0.093 | 0.000 | 0.000 | ||
| 3 spectra, VMTVNYNTHGELGEGAR | 0.688 | 0.073 | 0.090 | 0.000 | 0.000 | 0.148 | 0.000 | 0.000 | ||
| 2 spectra, SNTEIVEHIK | 0.317 | 0.610 | 0.000 | 0.000 | 0.000 | 0.030 | 0.000 | 0.043 |
| Plot | Lyso | Other | |||||||||||
| Expt C |
3 peptides |
13 spectra |
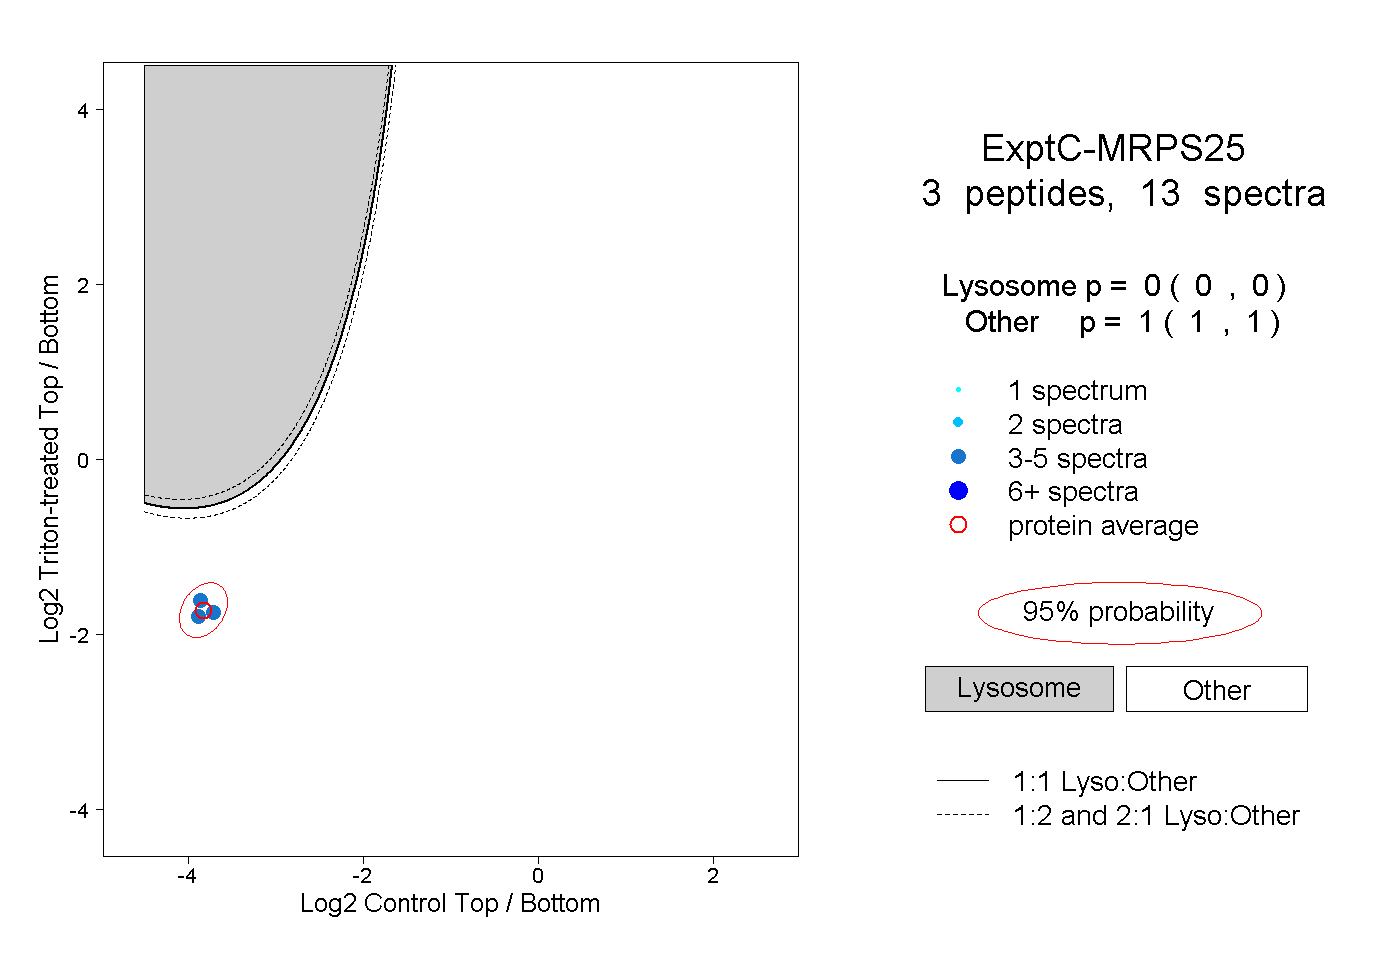 |
0.000 0.000 | 0.000 |
1.000 1.000 | 1.000 |
||||||||
| Plot | Lyso | Other | |||||||||||
| Expt D |
1 peptide |
2 spectra |
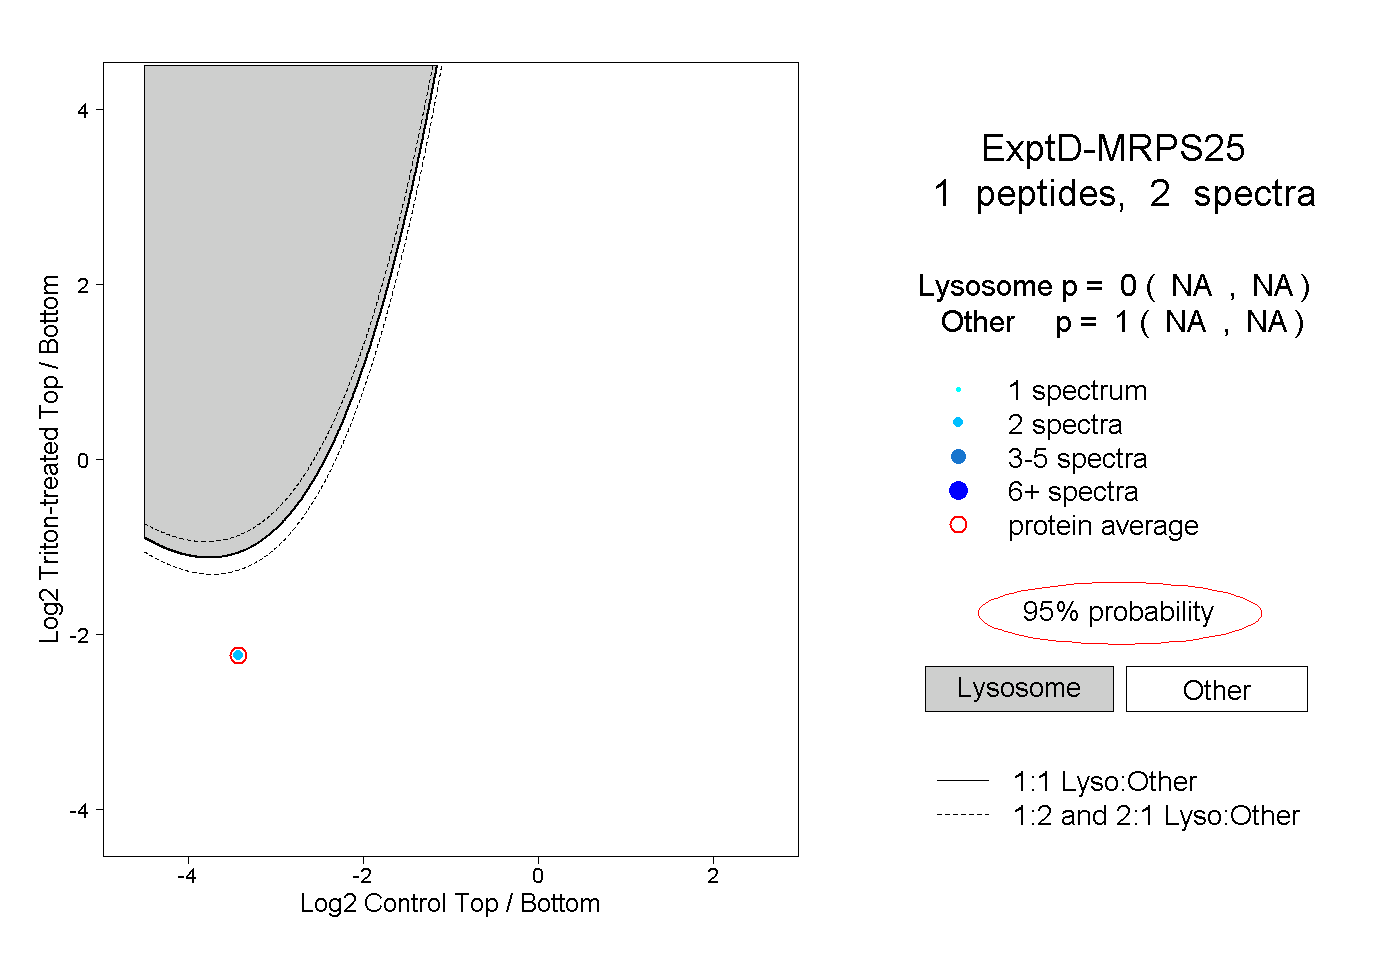 |
0.000 NA | NA |
1.000 NA | NA |