 5
5peptides
spectra
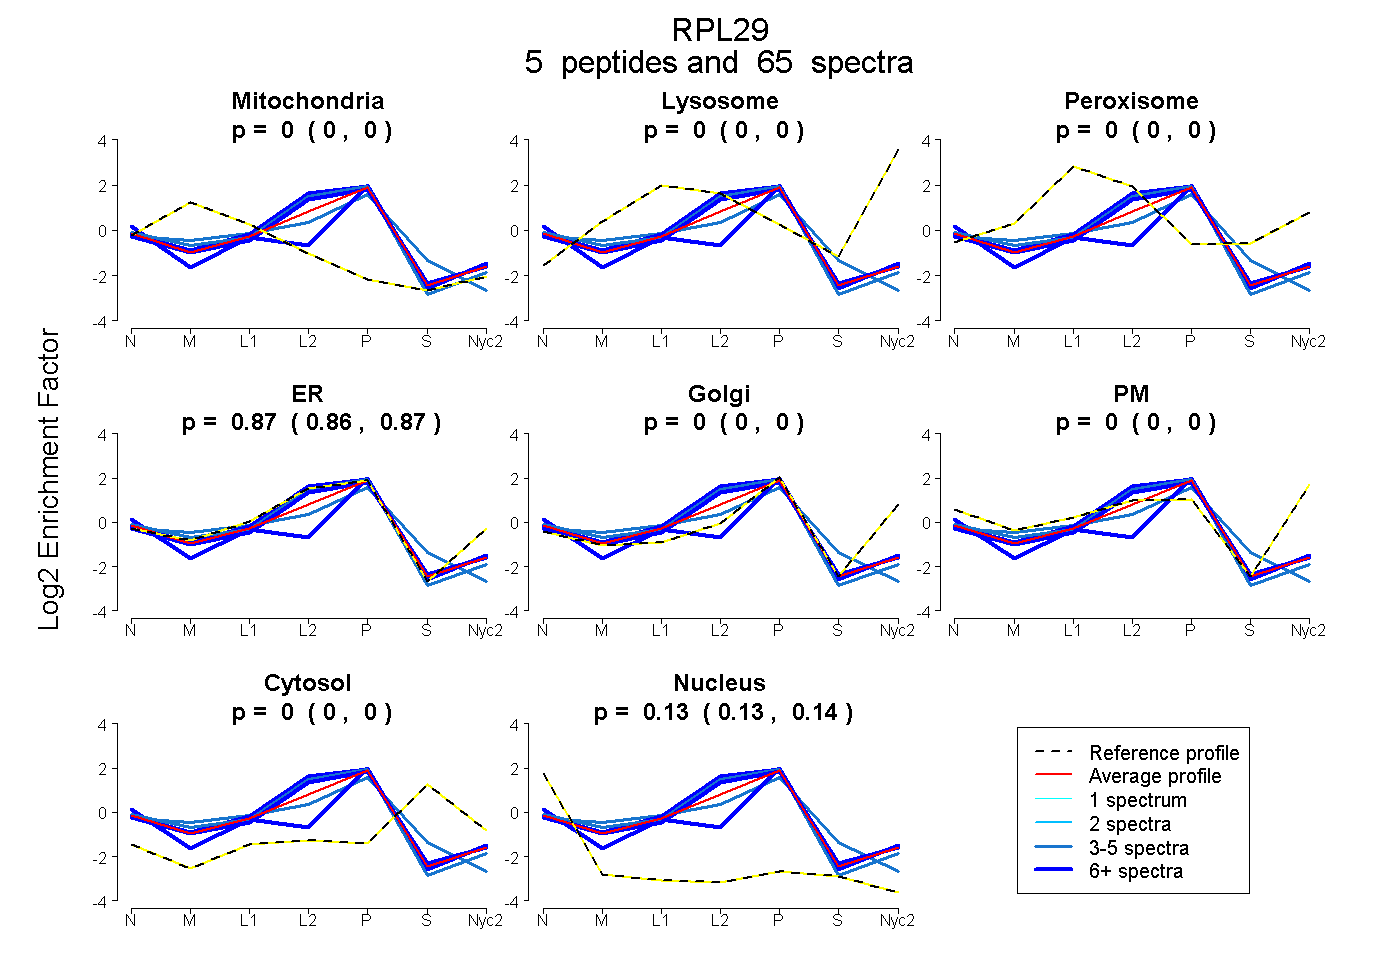
0.000 | 0.000
0.000 | 0.000
0.000 | 0.000
0.859 | 0.873
0.000 | 0.000
0.000 | 0.000
0.000 | 0.000
0.126 | 0.140
4peptides
spectra
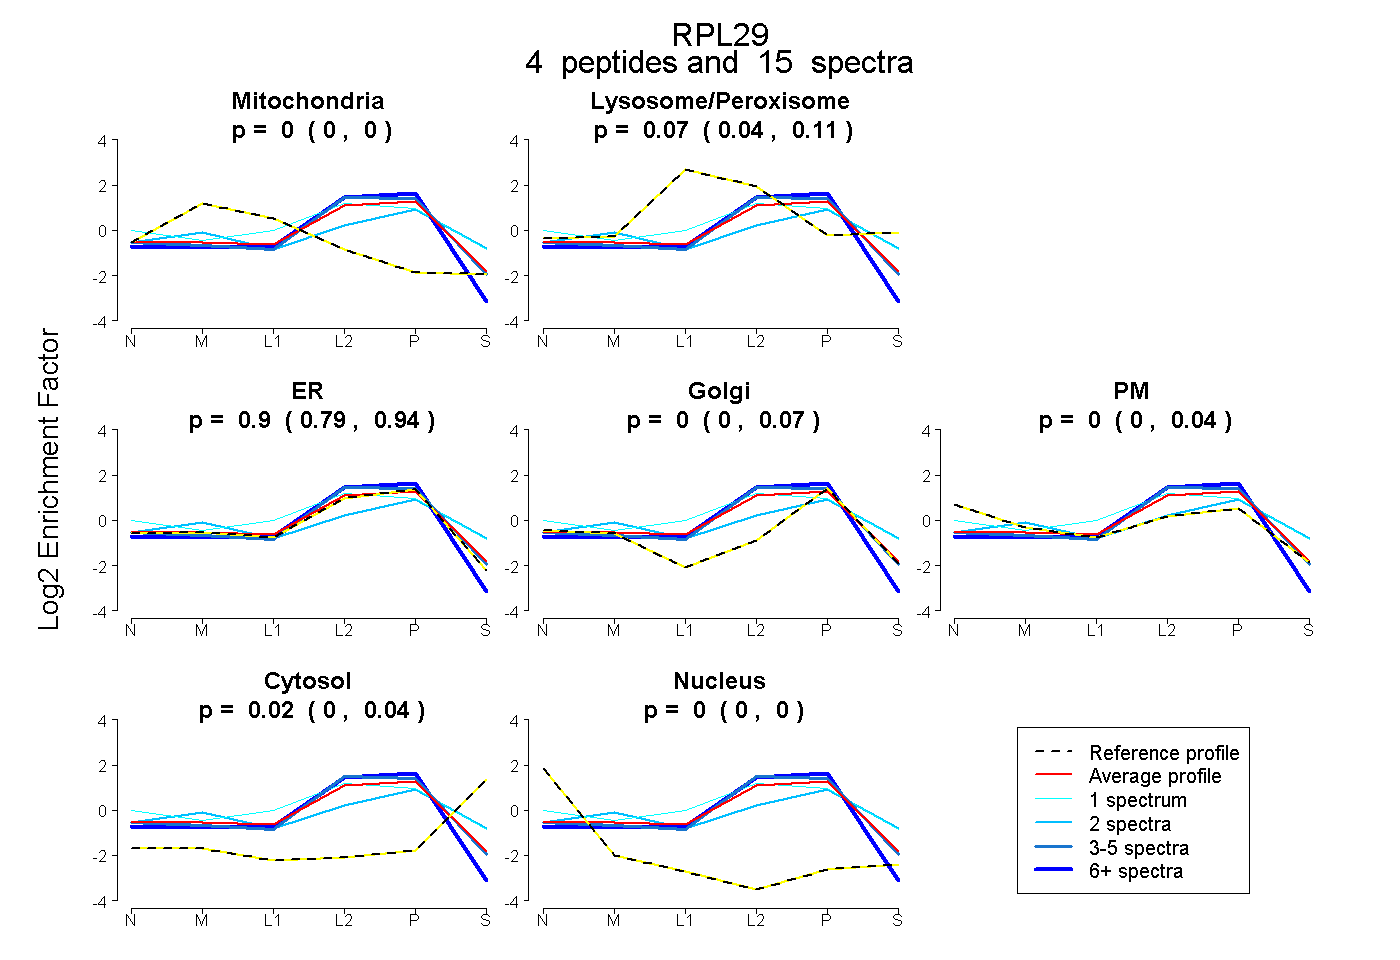
0.000 | 0.000
0.039 | 0.107
0.787 | 0.940
0.000 | 0.069
0.000 | 0.037
0.000 | 0.044
0.000 | 0.000
6peptides
spectra
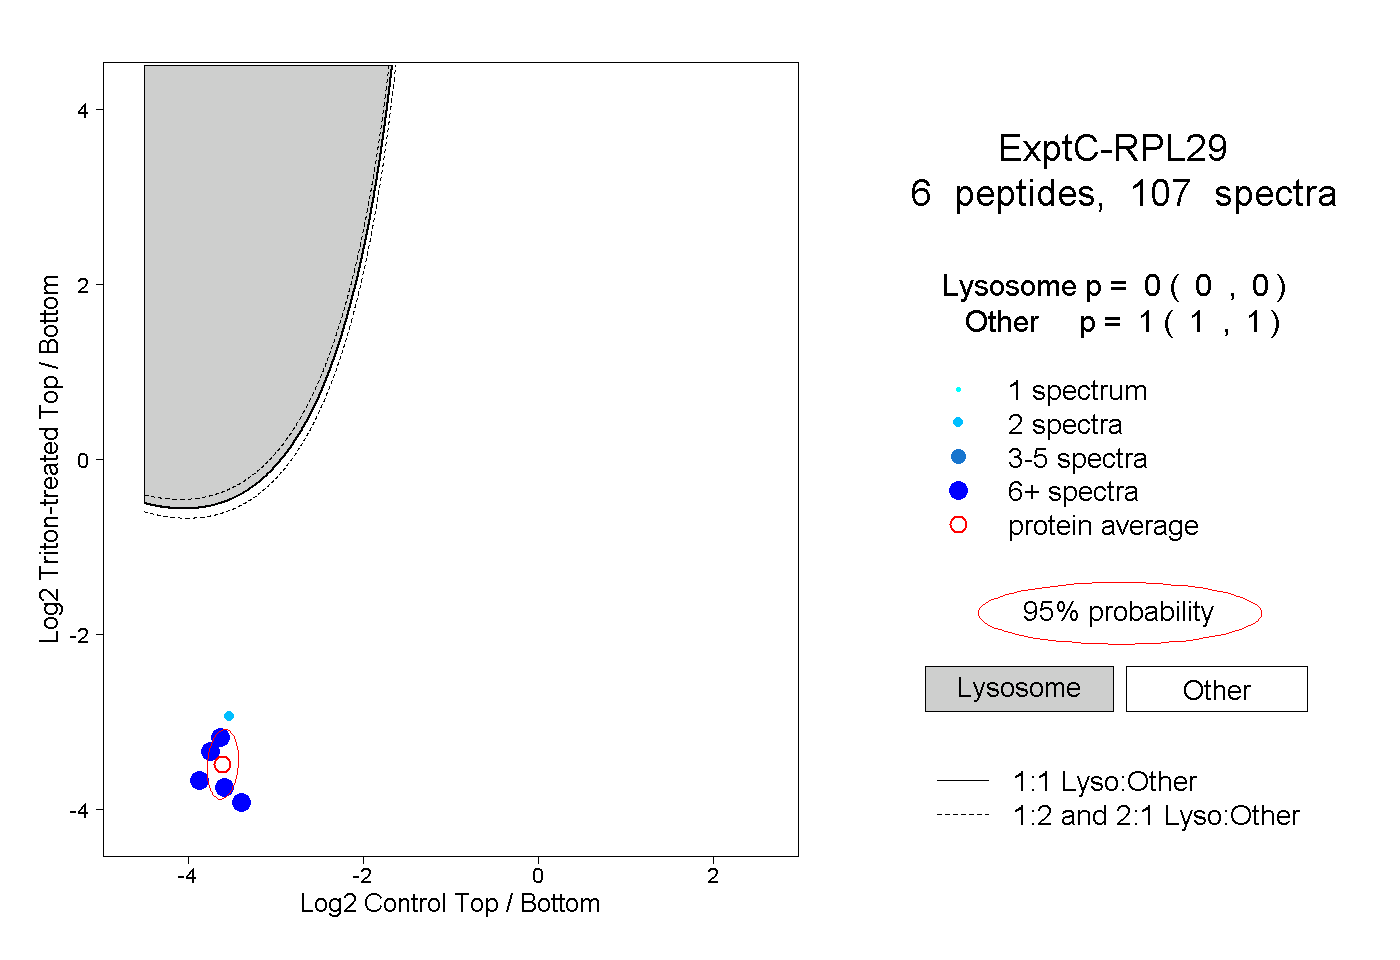
0.000 | 0.000
1.000 | 1.000
2peptides
spectra
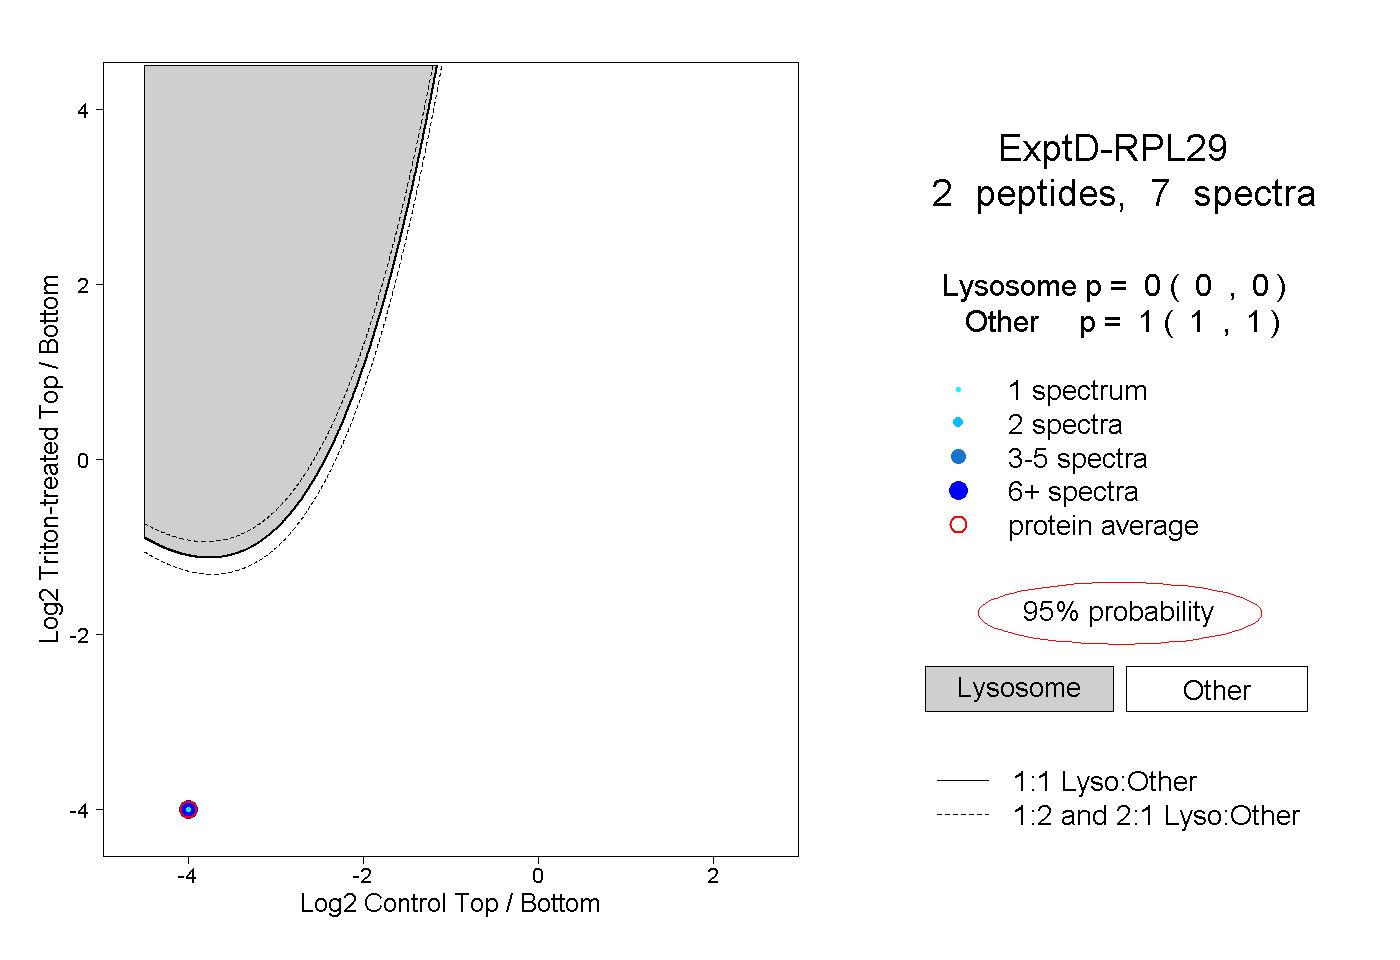
0.000 | 0.000
1.000 | 1.000