 5
5peptides
spectra
0.000 | 0.000
0.000 | 0.000
0.000 | 0.000
0.859 | 0.873
0.000 | 0.000
0.000 | 0.000
0.000 | 0.000
0.126 | 0.140
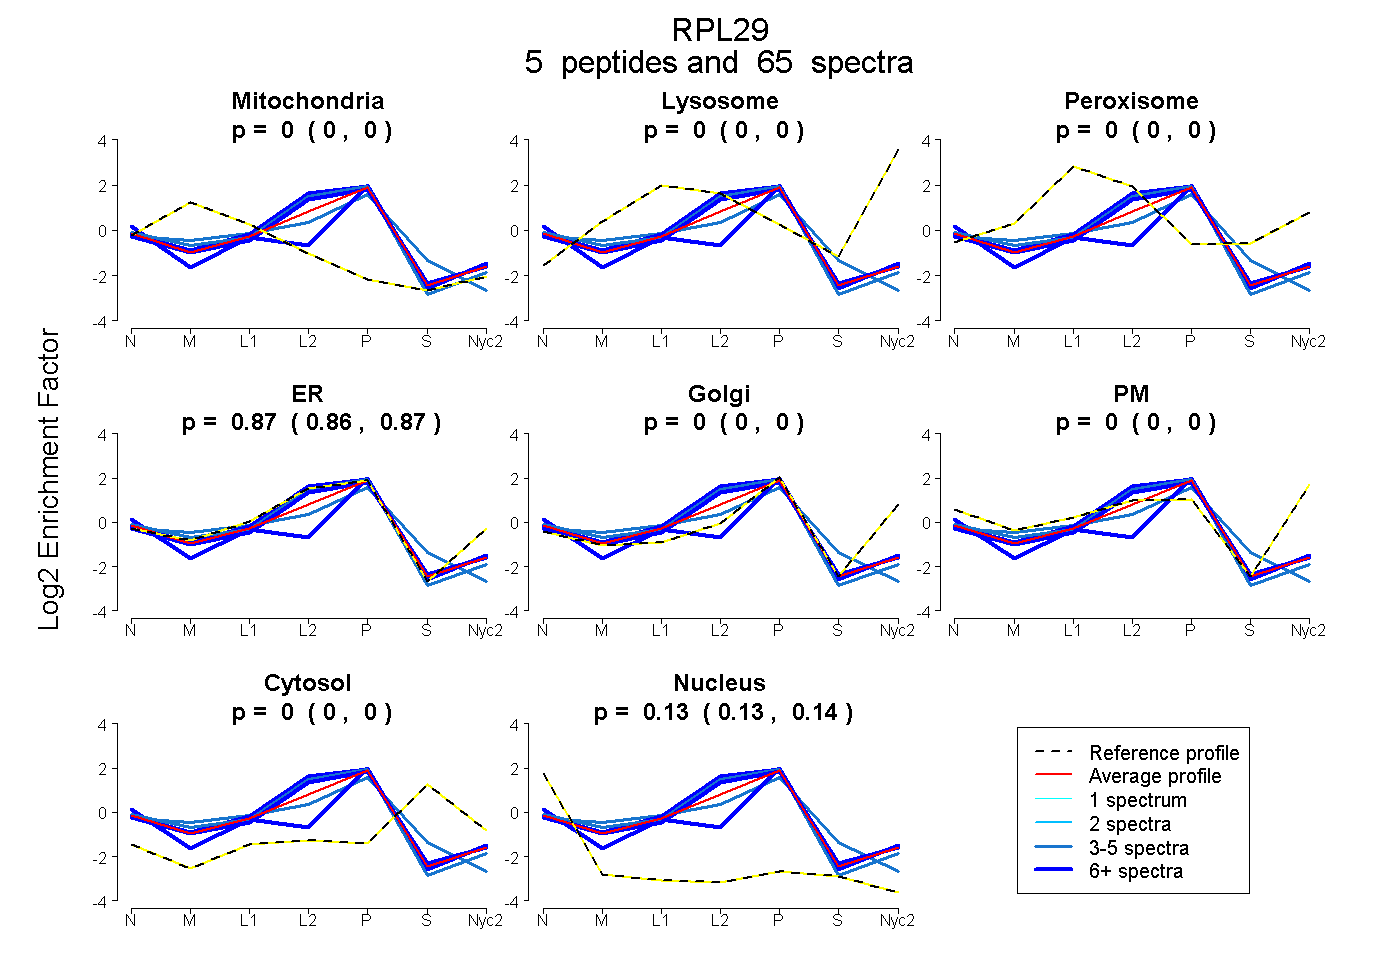
| Plot | Mito | Lyso | Perox | ER | Golgi | PM | Cytosol | Nucleus | |||||
| Expt A |
5 peptides |
65 spectra |
|
0.000 0.000 | 0.000 |
0.000 0.000 | 0.000 |
0.000 0.000 | 0.000 |
0.866 0.859 | 0.873 |
0.000 0.000 | 0.000 |
0.000 0.000 | 0.000 |
0.000 0.000 | 0.000 |
0.134 0.126 | 0.140 |
| 26 spectra, LAFIAHPK | 0.000 | 0.000 | 0.000 | 0.936 | 0.000 | 0.000 | 0.000 | 0.064 | ||
| 20 spectra, MQANNAK | 0.000 | 0.000 | 0.000 | 0.893 | 0.000 | 0.000 | 0.006 | 0.101 | ||
| 12 spectra, GAQAPVK | 0.000 | 0.000 | 0.000 | 0.496 | 0.281 | 0.000 | 0.000 | 0.224 | ||
| 3 spectra, LCQPKPK | 0.001 | 0.000 | 0.000 | 0.902 | 0.000 | 0.000 | 0.000 | 0.097 | ||
| 4 spectra, APAQAPK | 0.151 | 0.000 | 0.000 | 0.645 | 0.000 | 0.000 | 0.127 | 0.077 |
| Plot | Mito | Lyso or Perox | ER | Golgi | PM | Cytosol | Nucleus | ||||||
| Expt B |
4 peptides |
15 spectra |
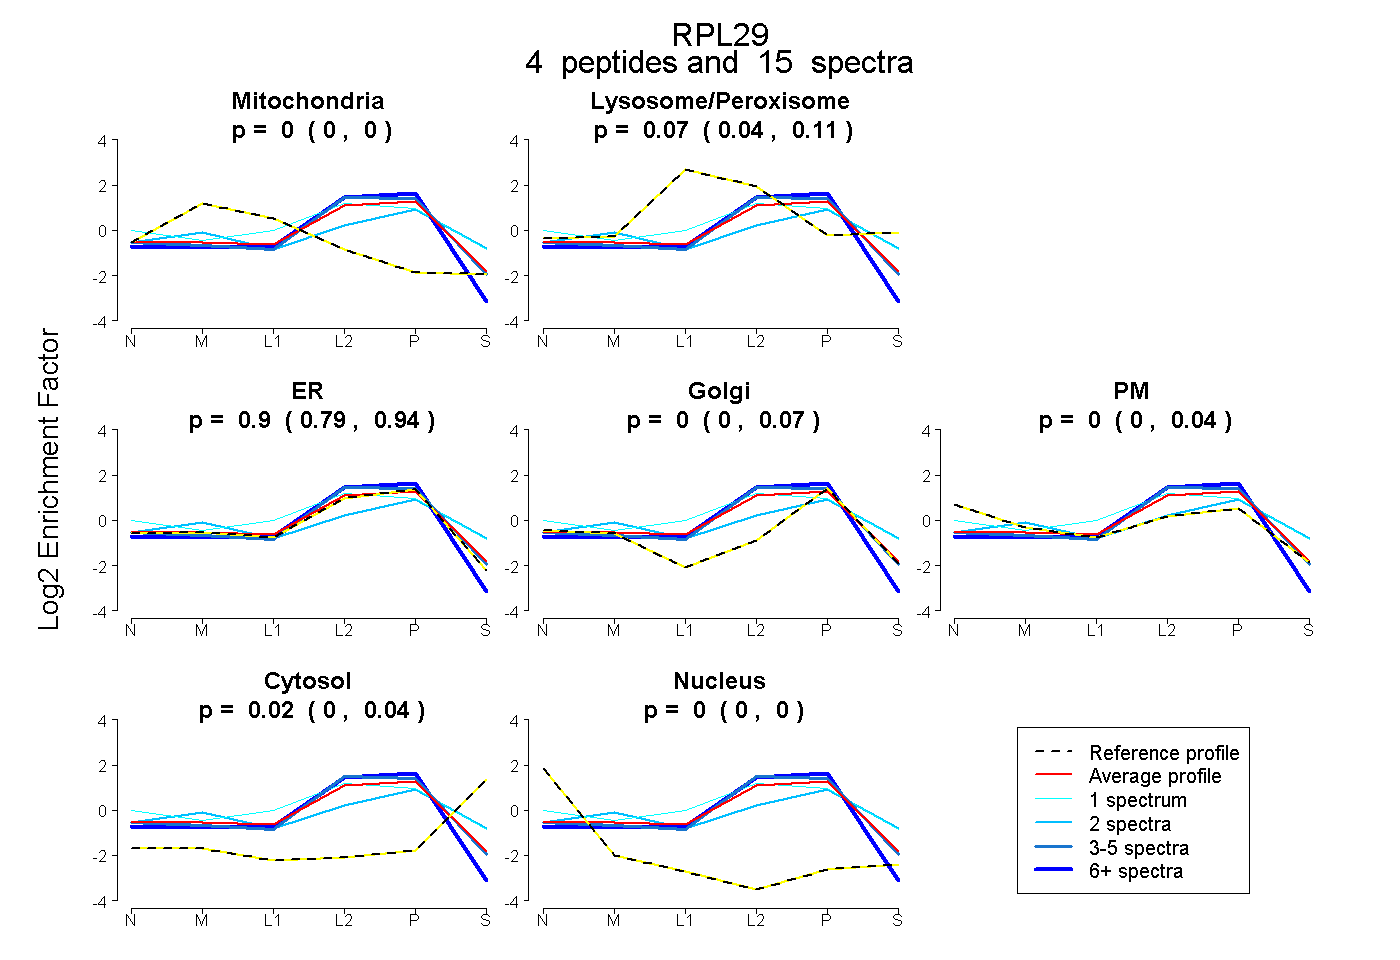 |
0.000 0.000 | 0.000 |
0.072 0.039 | 0.107 |
0.905 0.787 | 0.940 |
0.000 0.000 | 0.069 |
0.000 0.000 | 0.037 |
0.023 0.000 | 0.044 |
0.000 0.000 | 0.000 |
|||
| Plot | Lyso | Other | |||||||||||
| Expt C |
6 peptides |
107 spectra |
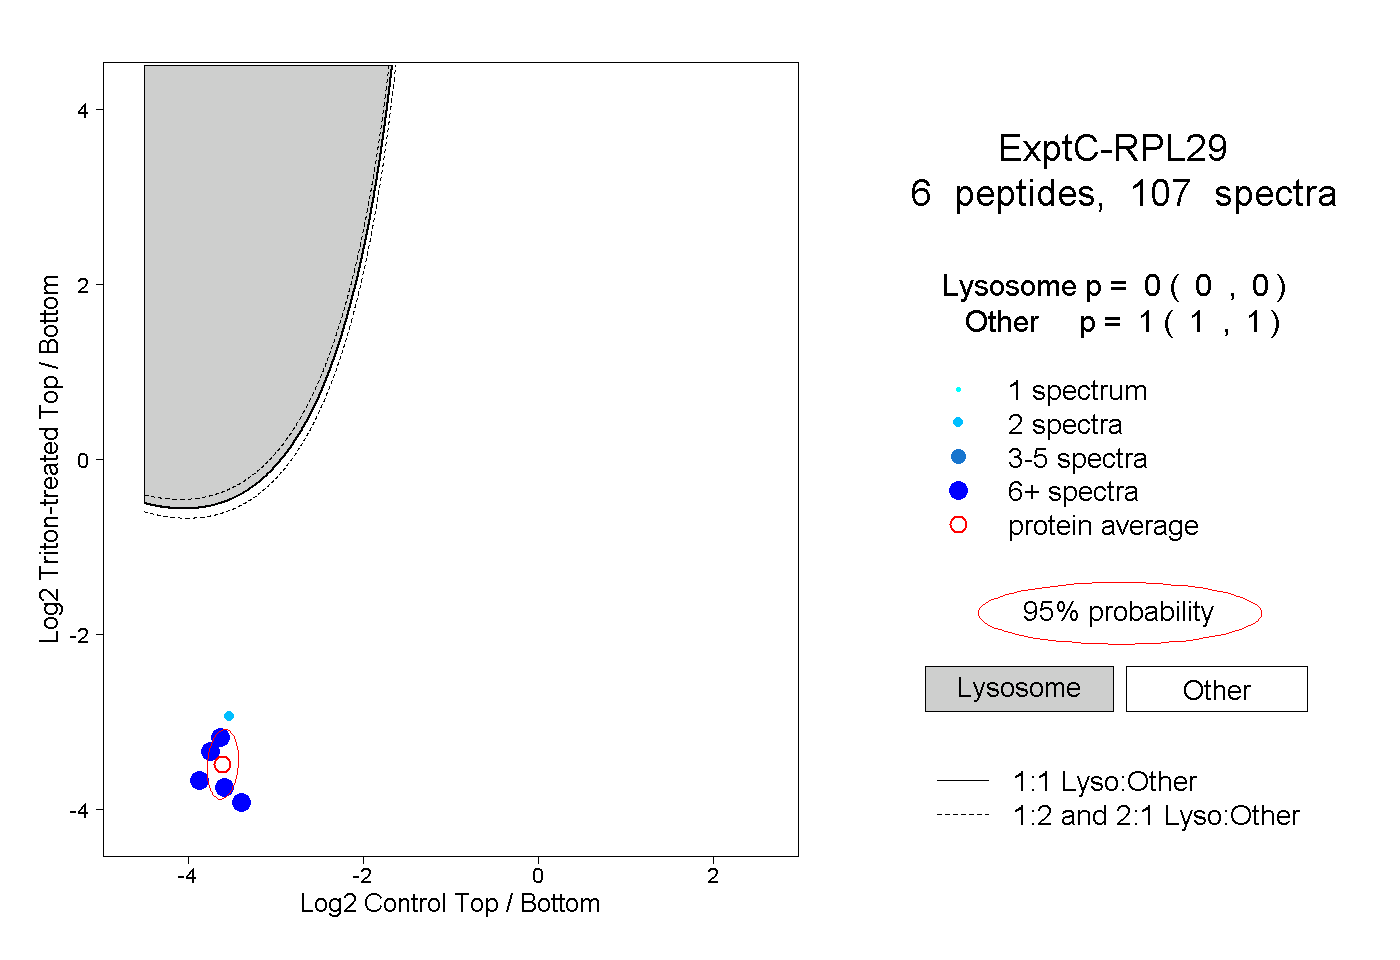 |
0.000 0.000 | 0.000 |
1.000 1.000 | 1.000 |
||||||||
| Plot | Lyso | Other | |||||||||||
| Expt D |
2 peptides |
7 spectra |
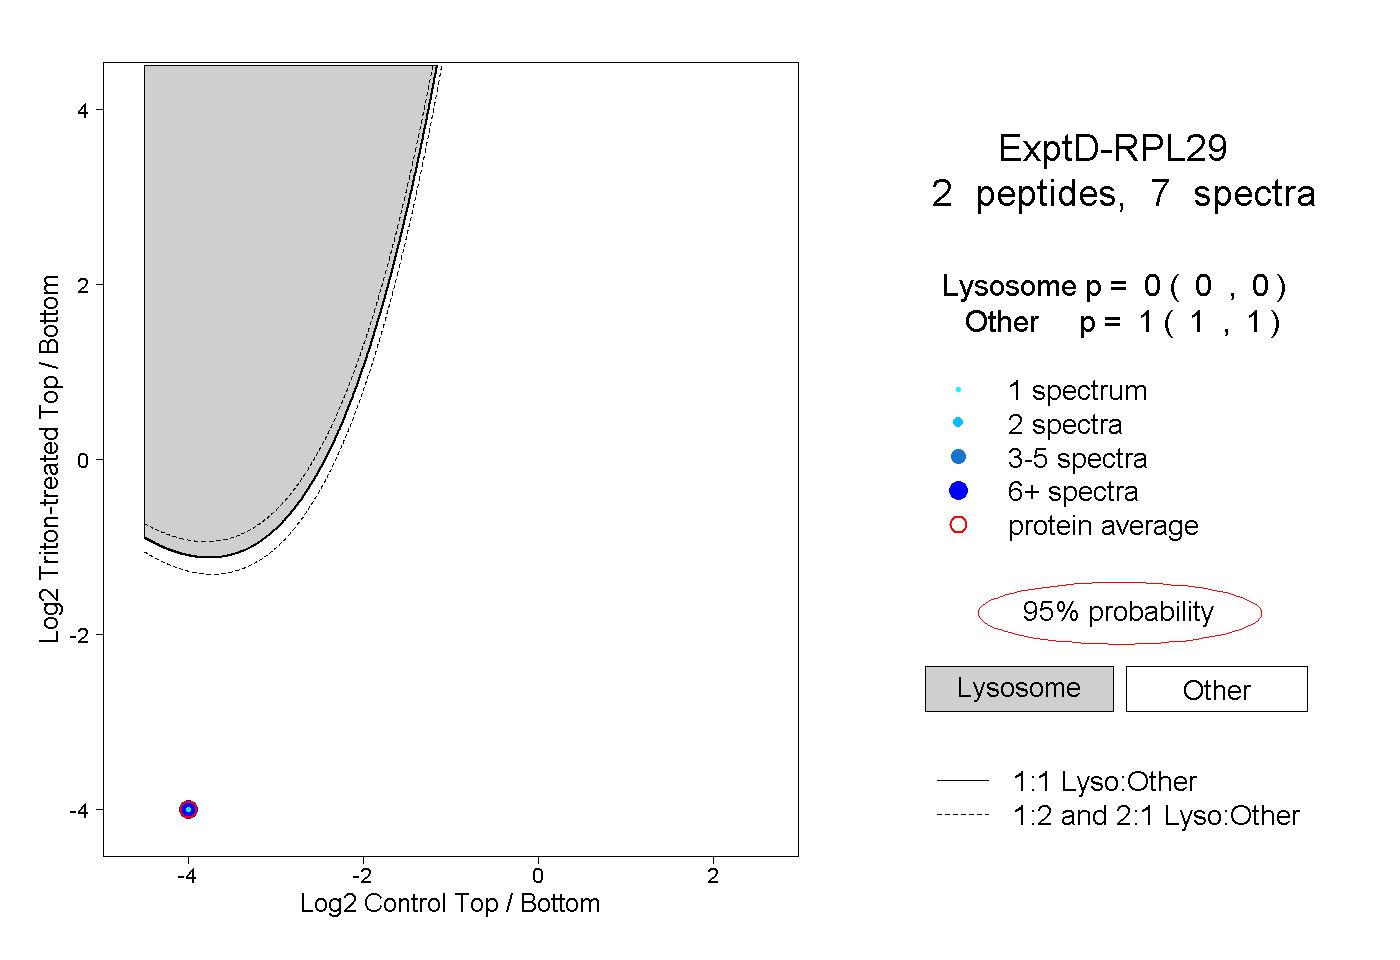 |
0.000 0.000 | 0.000 |
1.000 1.000 | 1.000 |