 5
5peptides
spectra
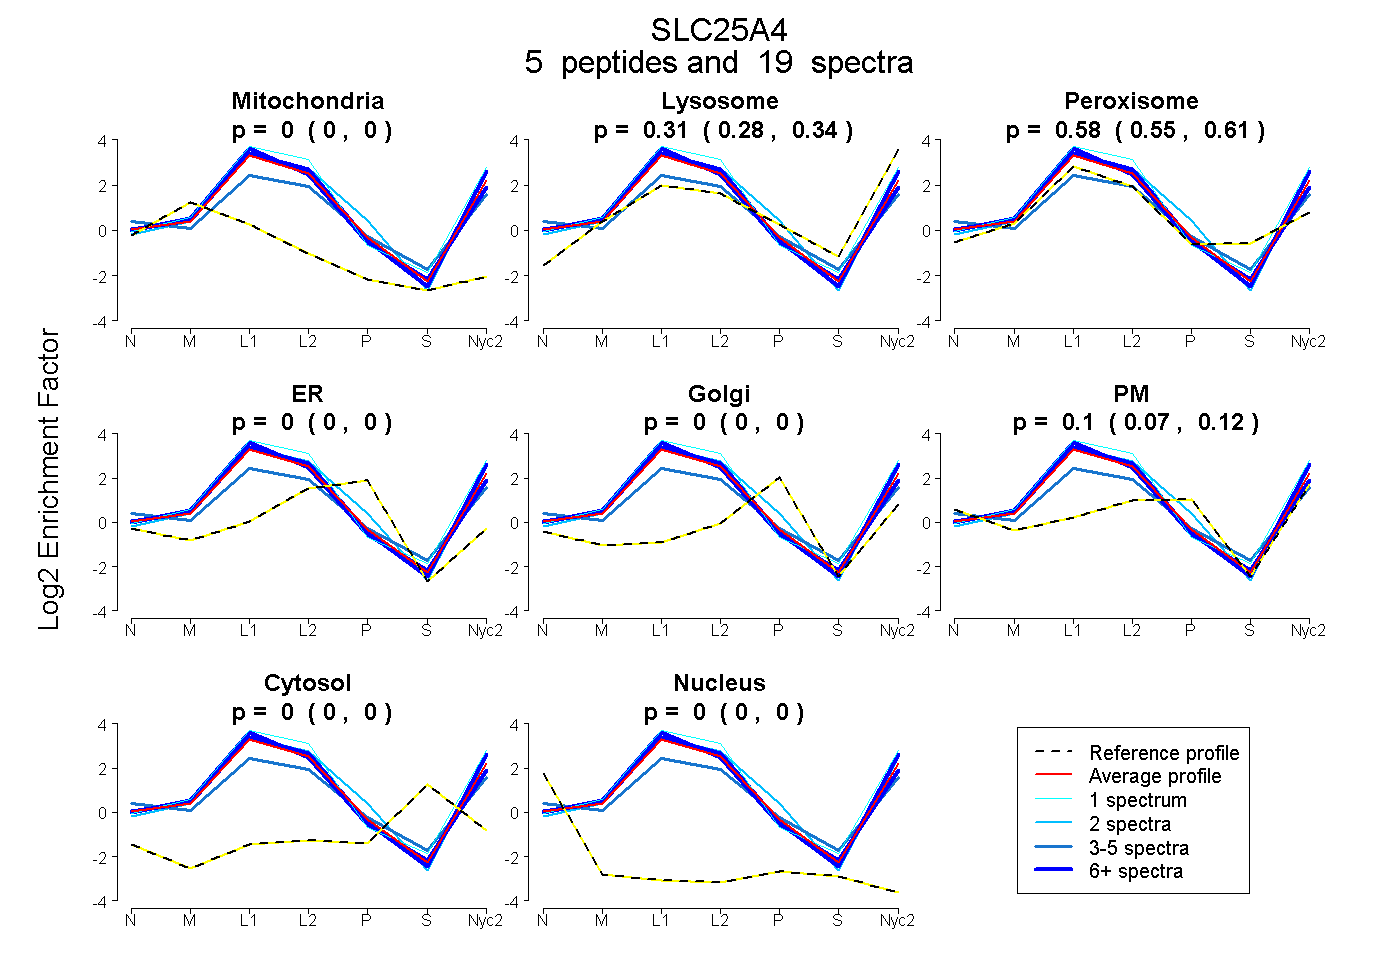
0.000 | 0.000
0.282 | 0.342
0.548 | 0.613
0.000 | 0.000
0.000 | 0.000
0.073 | 0.124
0.000 | 0.000
0.000 | 0.000
4peptides
spectra
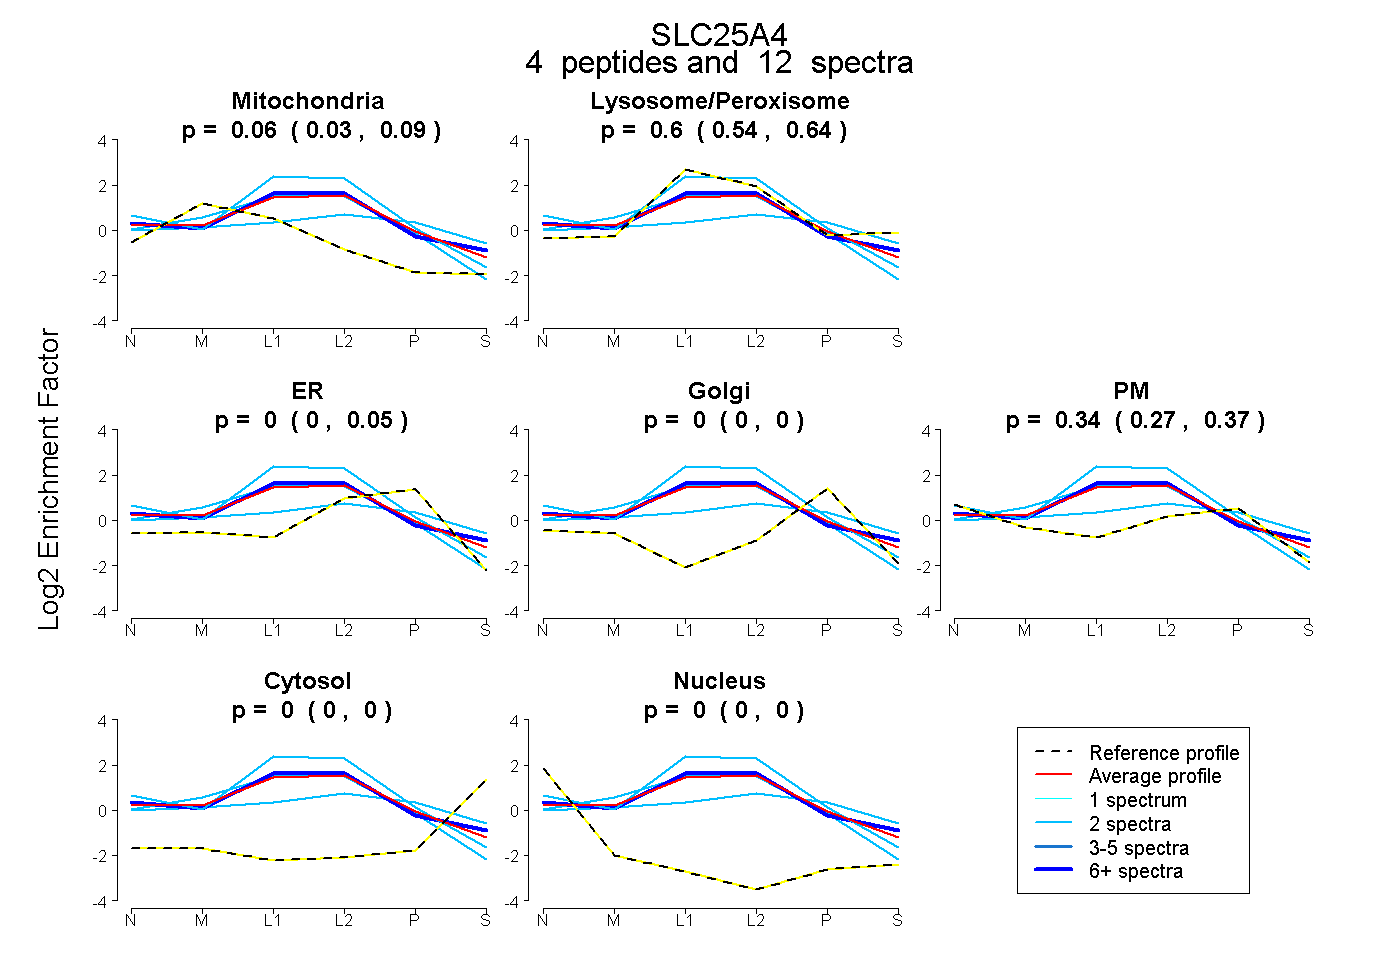
0.033 | 0.094
0.545 | 0.637
0.000 | 0.050
0.000 | 0.000
0.268 | 0.368
0.000 | 0.000
0.000 | 0.000
8peptides
spectra
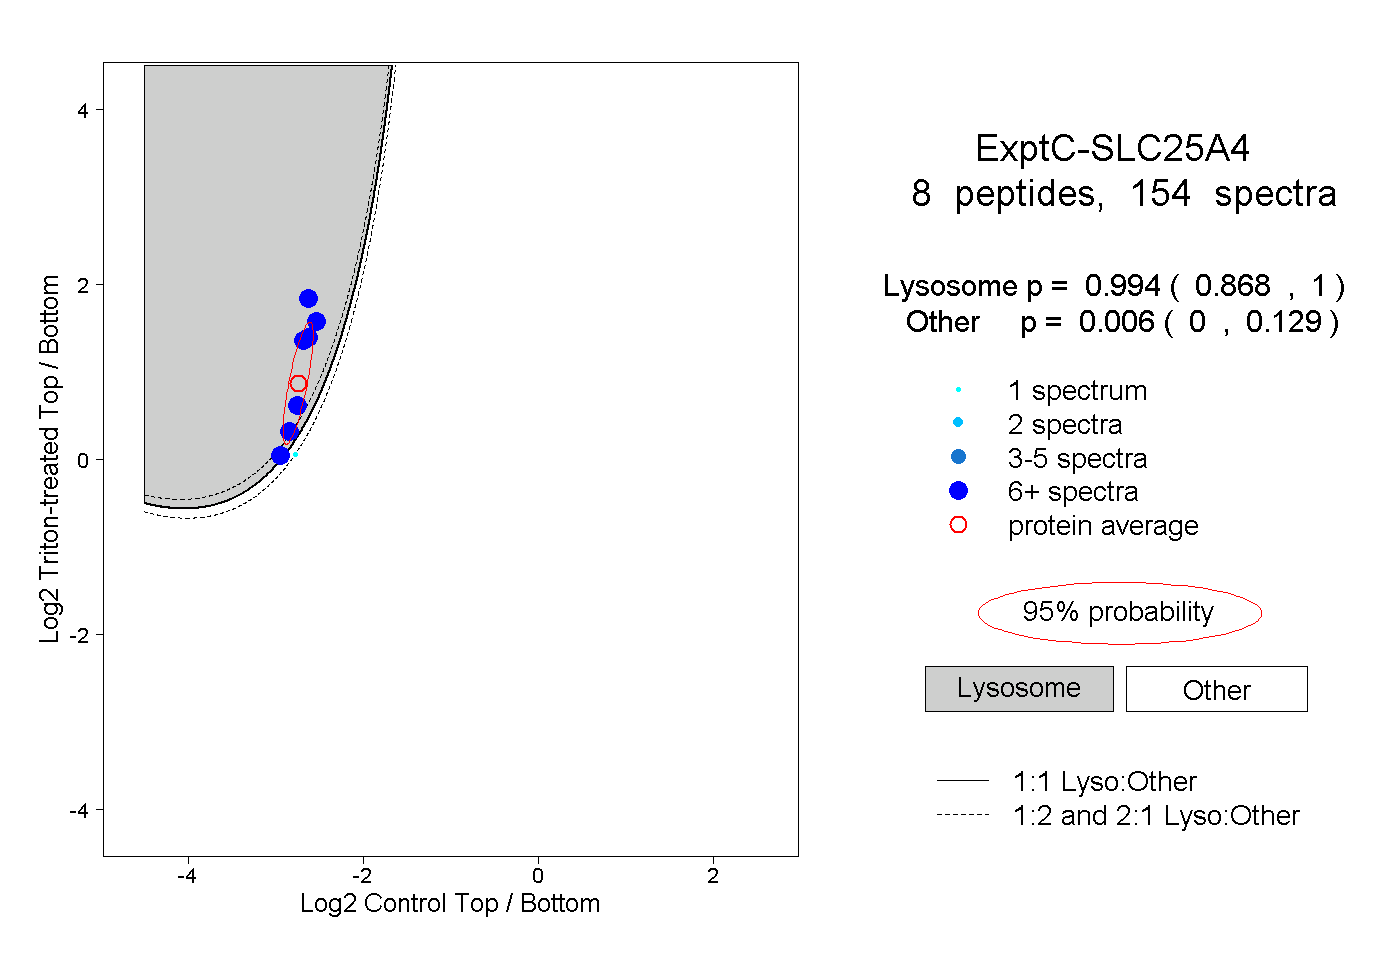
0.868 | 1.000
0.000 | 0.129
2peptides
spectra
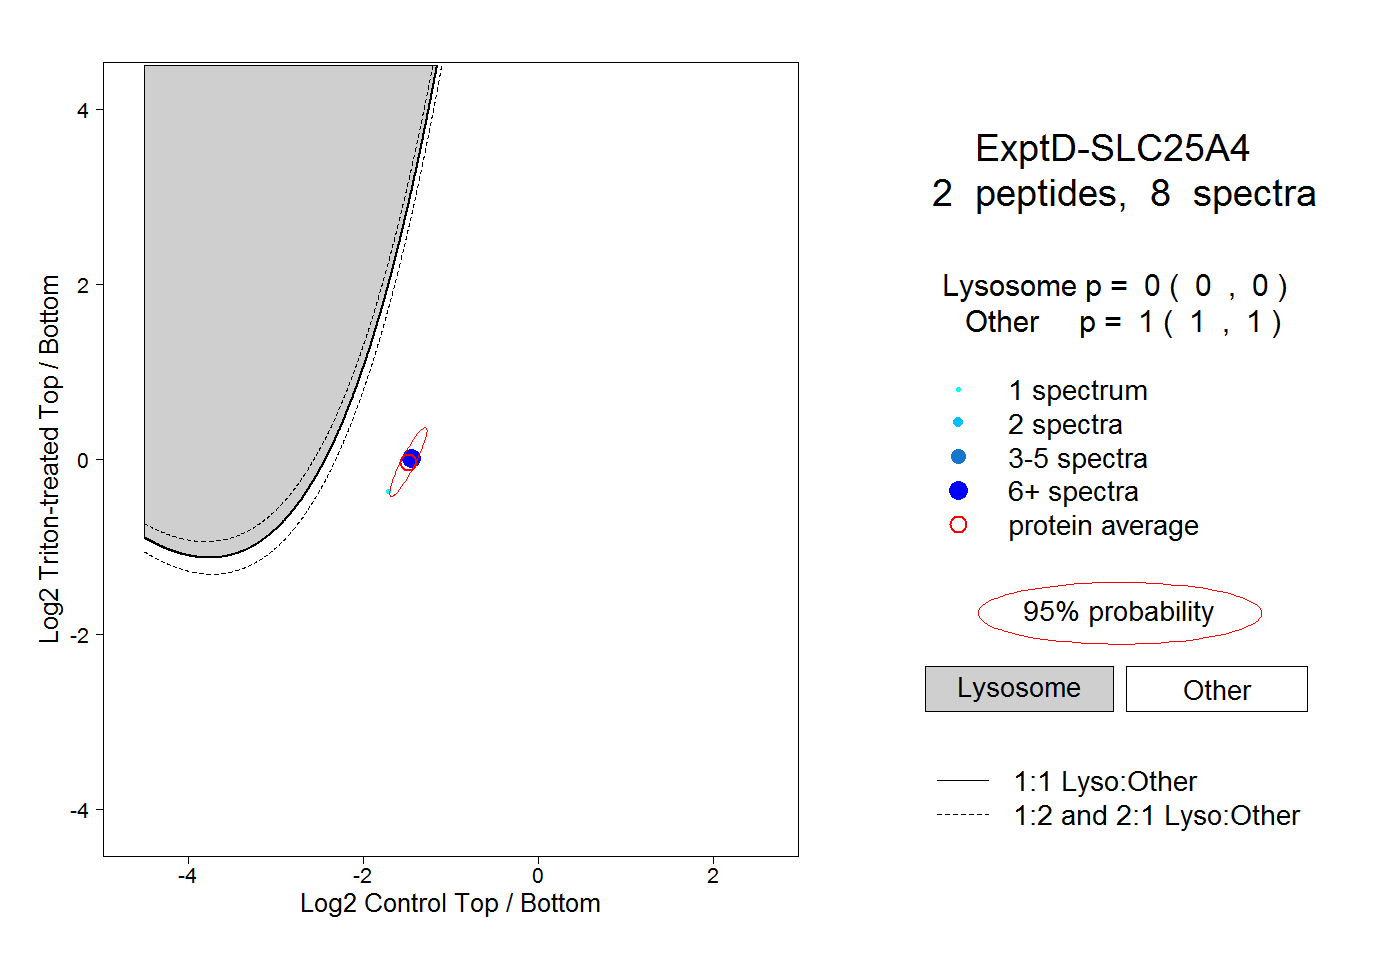
0.000 | 0.000
1.000 | 1.000