 5
5peptides
spectra
0.000 | 0.000
0.282 | 0.342
0.548 | 0.613
0.000 | 0.000
0.000 | 0.000
0.073 | 0.124
0.000 | 0.000
0.000 | 0.000
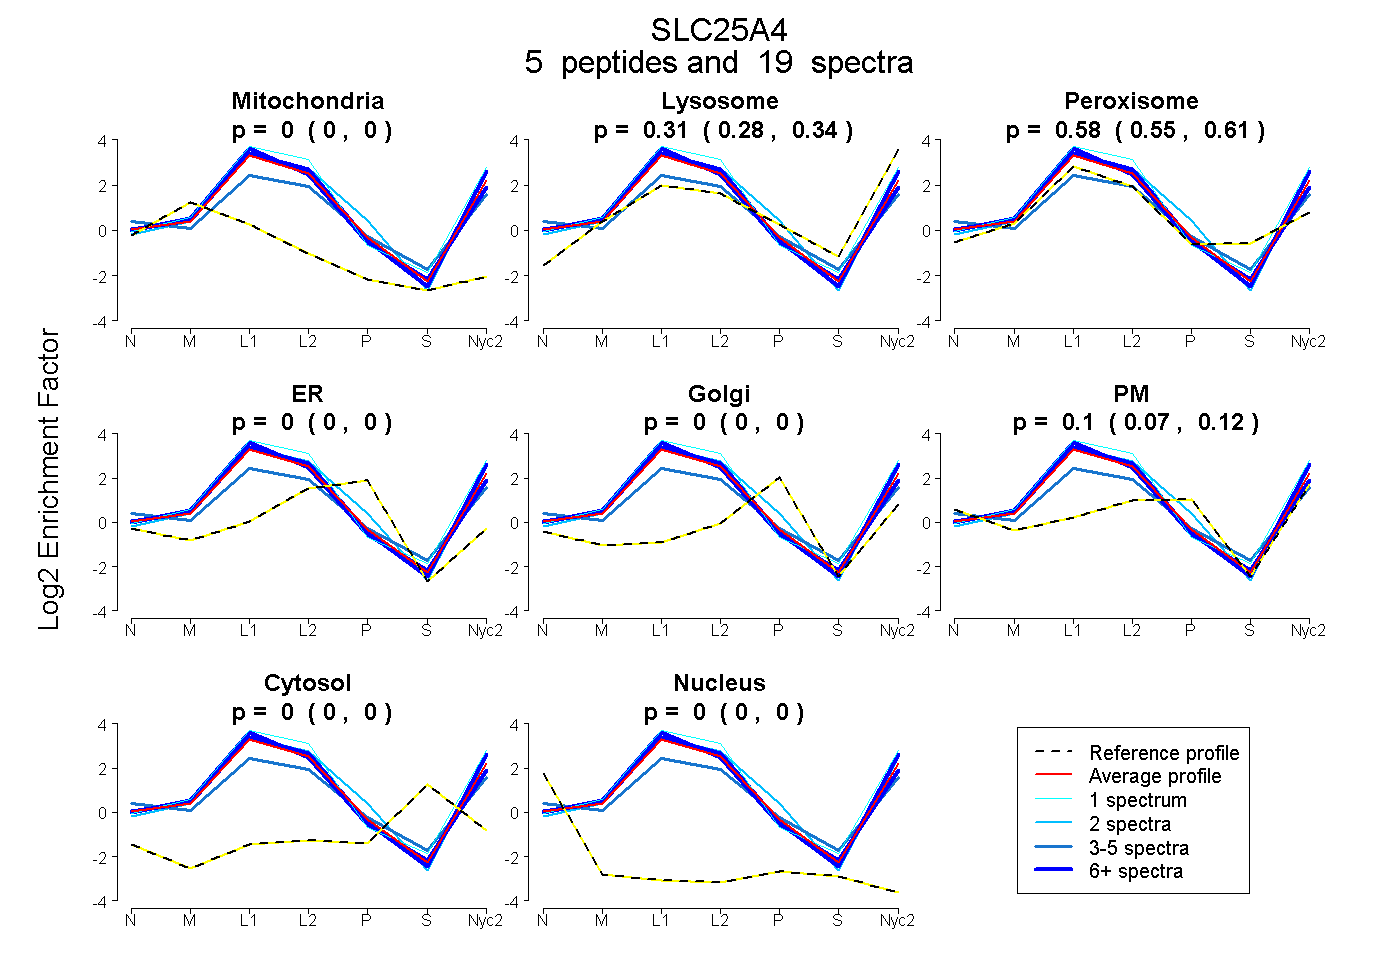
| Plot | Mito | Lyso | Perox | ER | Golgi | PM | Cytosol | Nucleus | |||||
| Expt A |
5 peptides |
19 spectra |
|
0.000 0.000 | 0.000 |
0.315 0.282 | 0.342 |
0.584 0.548 | 0.613 |
0.000 0.000 | 0.000 |
0.000 0.000 | 0.000 |
0.101 0.073 | 0.124 |
0.000 0.000 | 0.000 |
0.000 0.000 | 0.000 |
| 3 spectra, EFNGLGDCLTK | 0.000 | 0.041 | 0.636 | 0.000 | 0.000 | 0.323 | 0.000 | 0.000 | ||
| 7 spectra, EQGFLSFWR | 0.000 | 0.429 | 0.507 | 0.000 | 0.000 | 0.064 | 0.000 | 0.000 | ||
| 2 spectra, DFLAGGIAAAVSK | 0.000 | 0.456 | 0.408 | 0.000 | 0.000 | 0.137 | 0.000 | 0.000 | ||
| 1 spectrum, QIFLGGVDR | 0.000 | 0.437 | 0.563 | 0.000 | 0.000 | 0.000 | 0.000 | 0.000 | ||
| 6 spectra, GADIMYTGTVDCWR | 0.000 | 0.239 | 0.734 | 0.000 | 0.000 | 0.026 | 0.000 | 0.000 |
| Plot | Mito | Lyso or Perox | ER | Golgi | PM | Cytosol | Nucleus | ||||||
| Expt B |
4 peptides |
12 spectra |
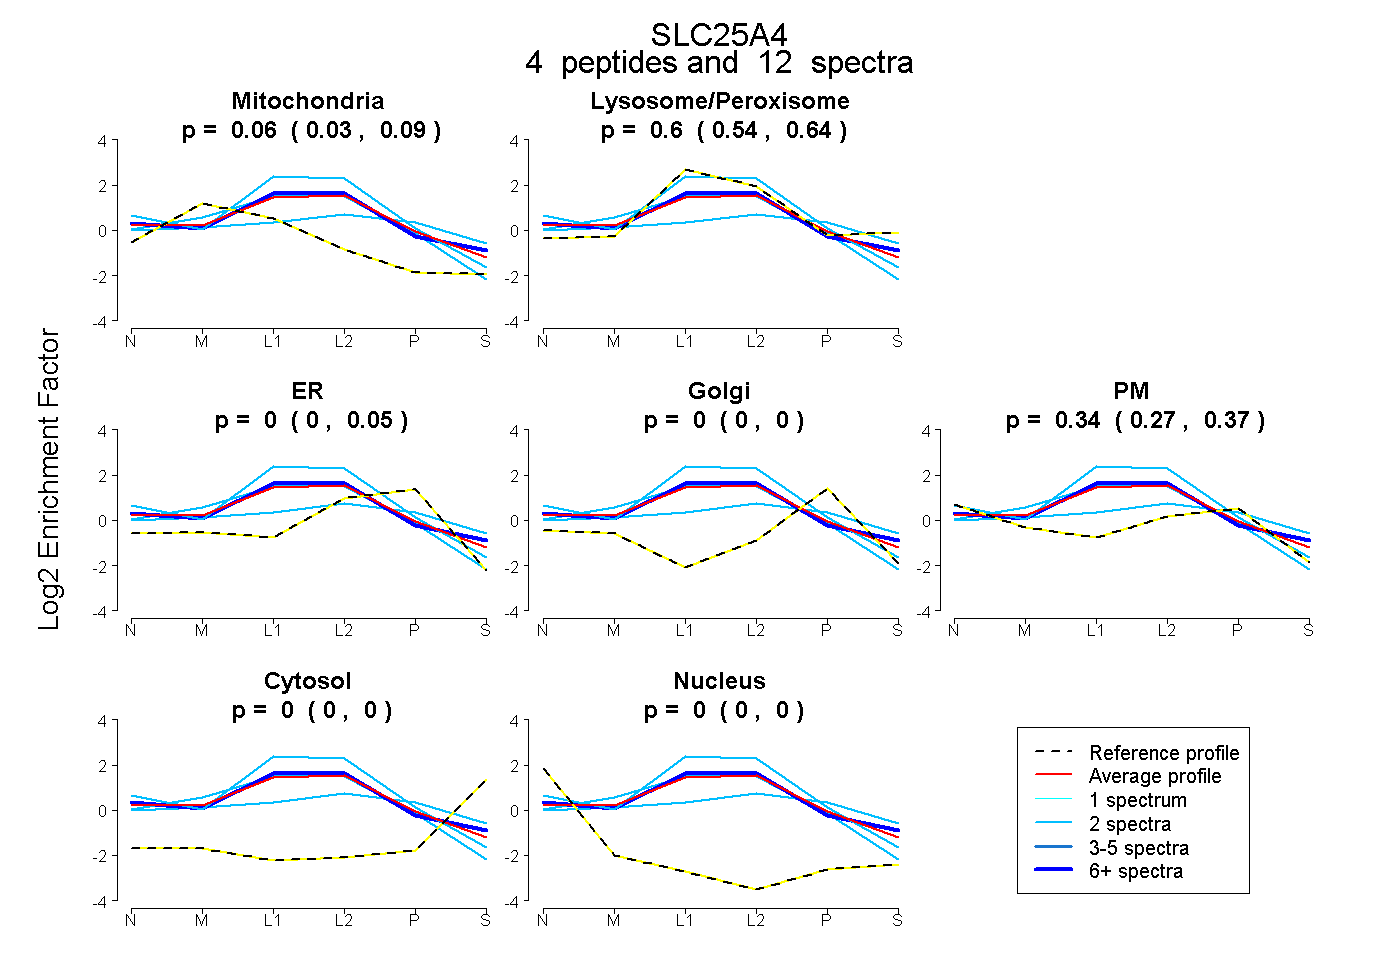 |
0.064 0.033 | 0.094 |
0.597 0.545 | 0.637 |
0.000 0.000 | 0.050 |
0.000 0.000 | 0.000 |
0.338 0.268 | 0.368 |
0.000 0.000 | 0.000 |
0.000 0.000 | 0.000 |
|||
| Plot | Lyso | Other | |||||||||||
| Expt C |
8 peptides |
154 spectra |
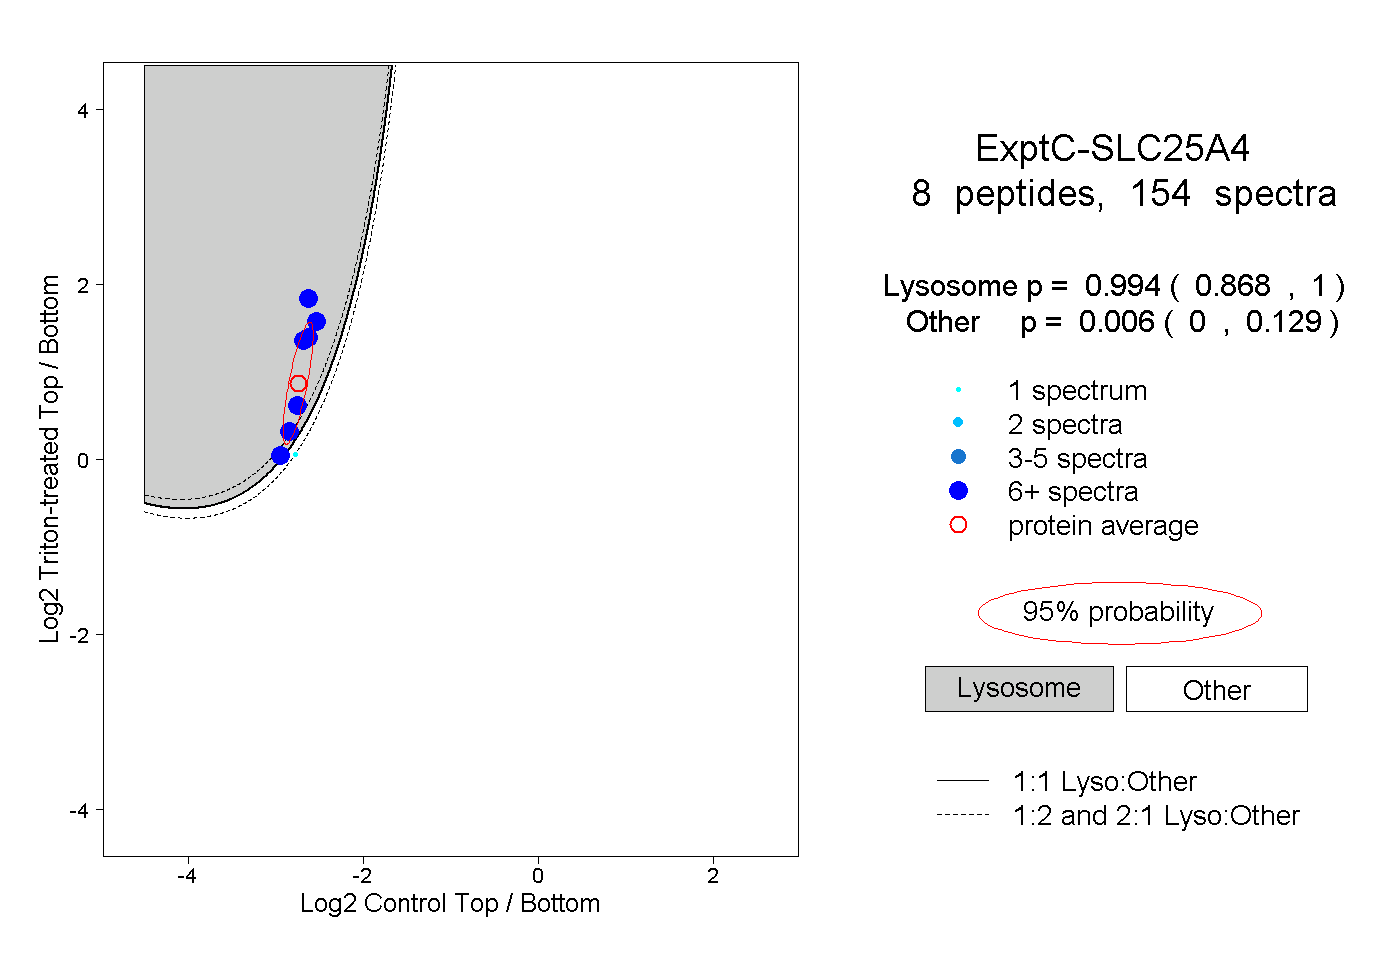 |
0.994 0.868 | 1.000 |
0.006 0.000 | 0.129 |
||||||||
| Plot | Lyso | Other | |||||||||||
| Expt D |
2 peptides |
8 spectra |
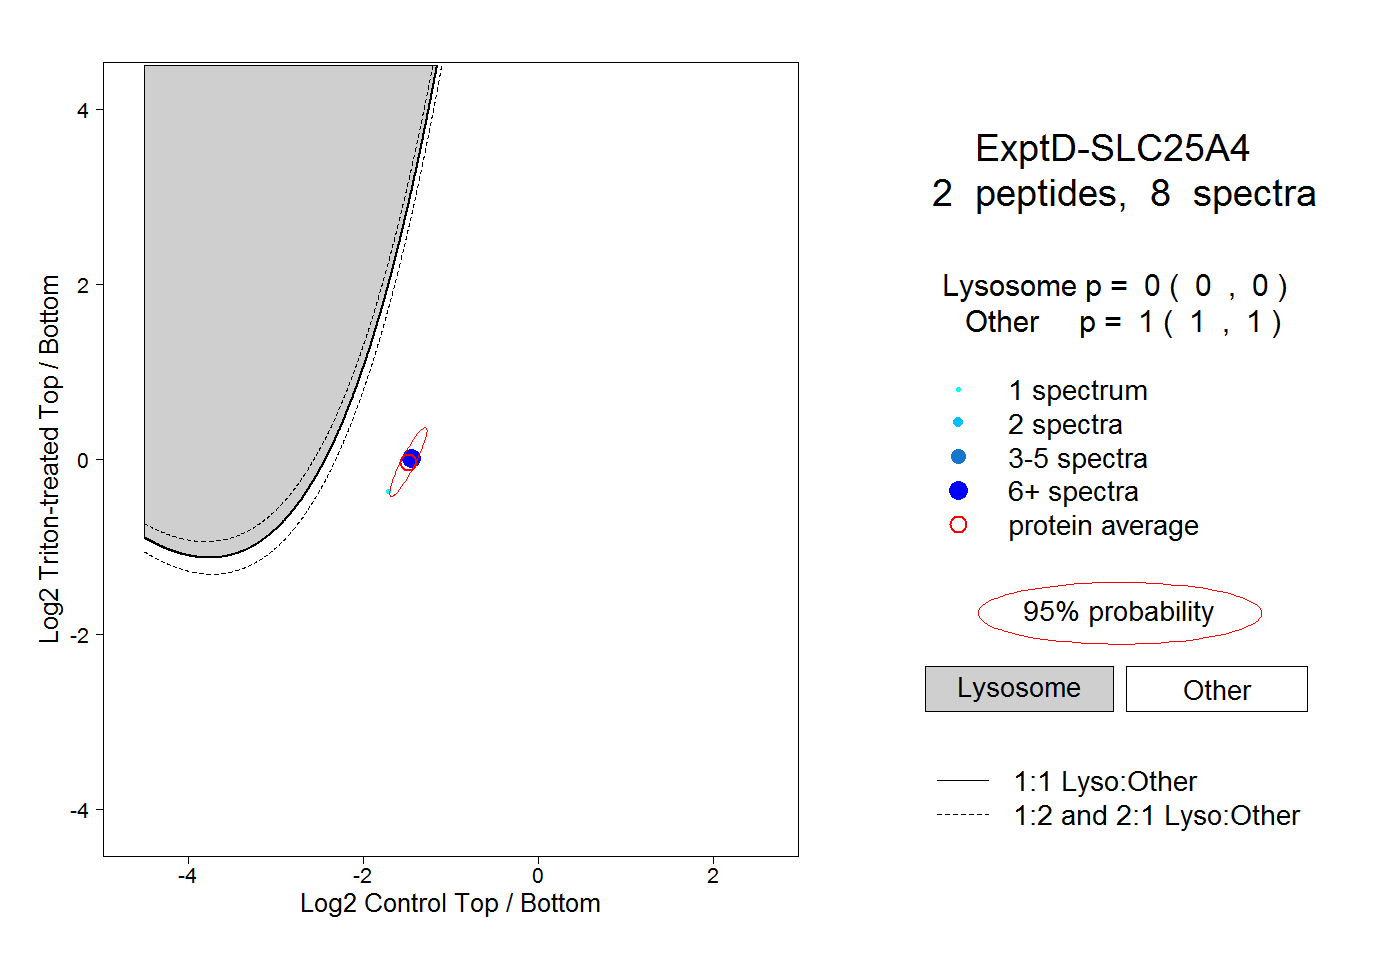 |
0.000 0.000 | 0.000 |
1.000 1.000 | 1.000 |