 7
7peptides
spectra
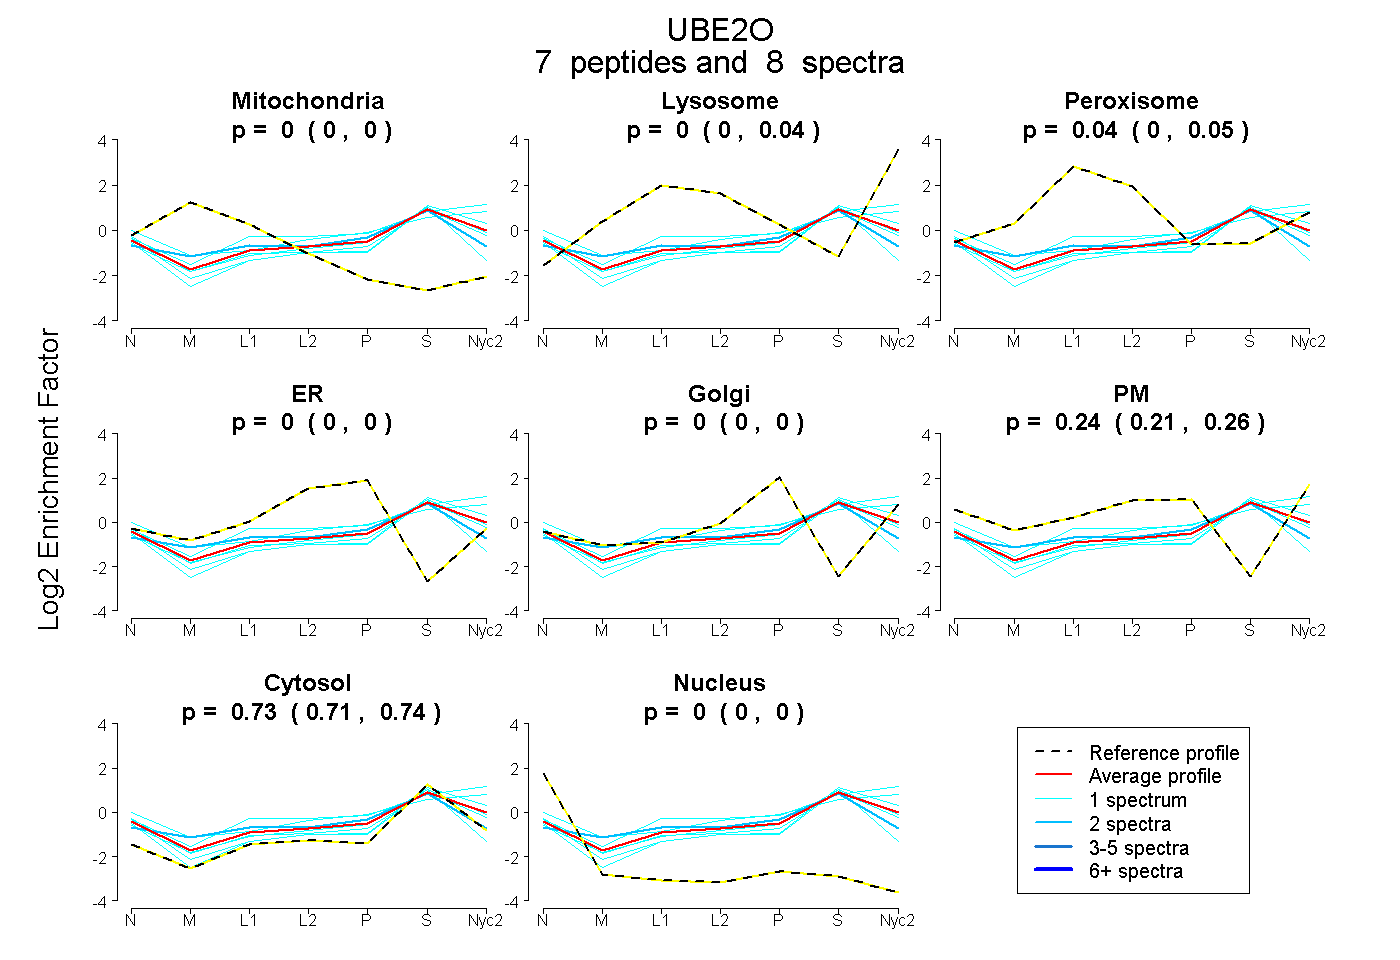
0.000 | 0.000
0.000 | 0.041
0.000 | 0.054
0.000 | 0.000
0.000 | 0.000
0.212 | 0.255
0.709 | 0.741
0.000 | 0.000
1peptide
spectrum
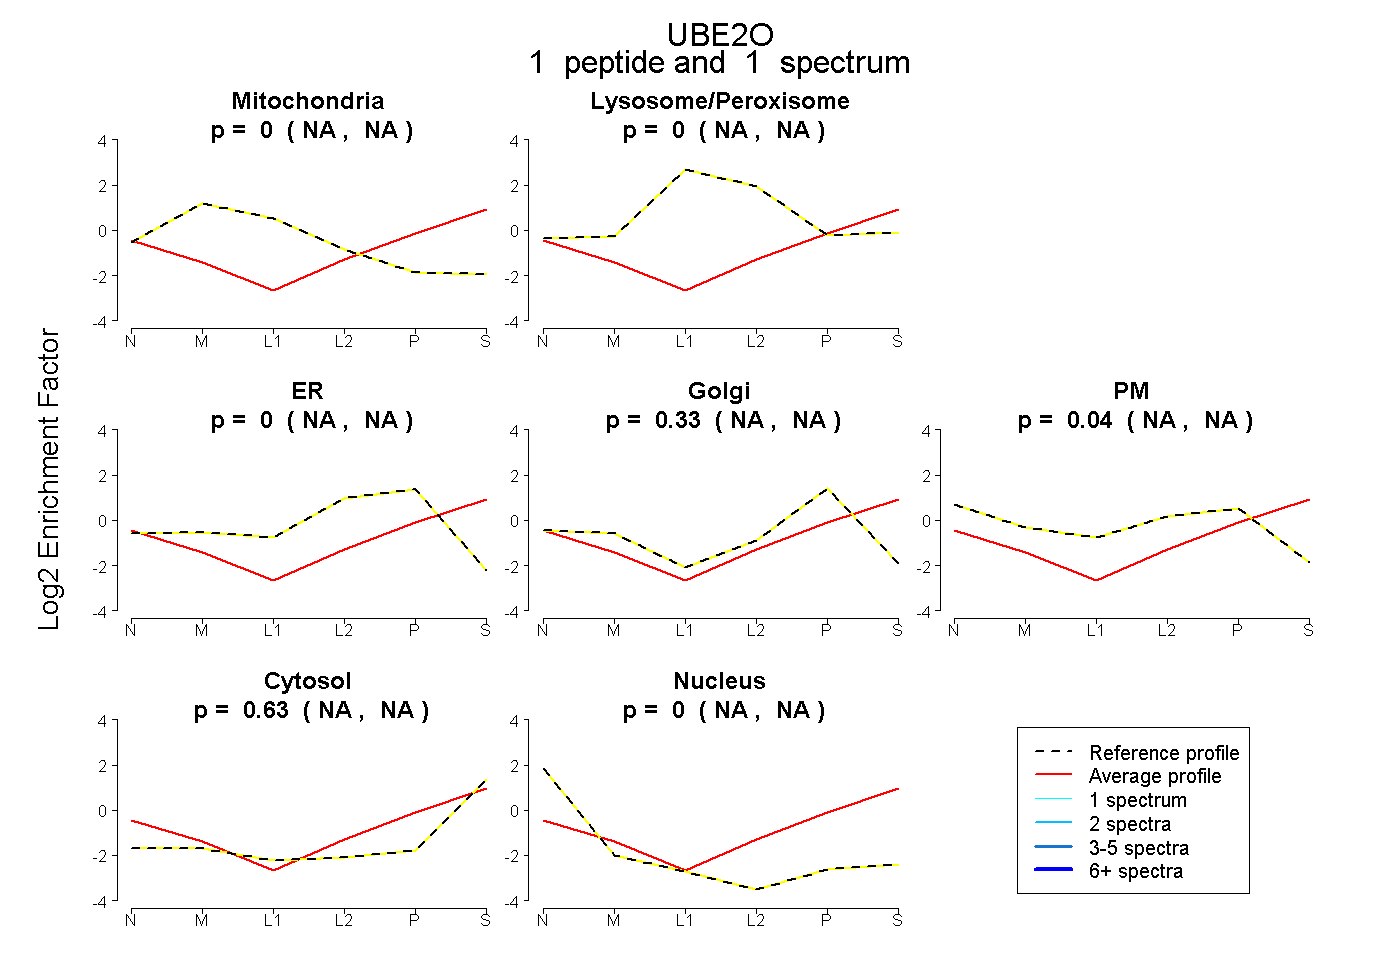
NA | NA
NA | NA
NA | NA
NA | NA
NA | NA
NA | NA
NA | NA
3peptides
spectra
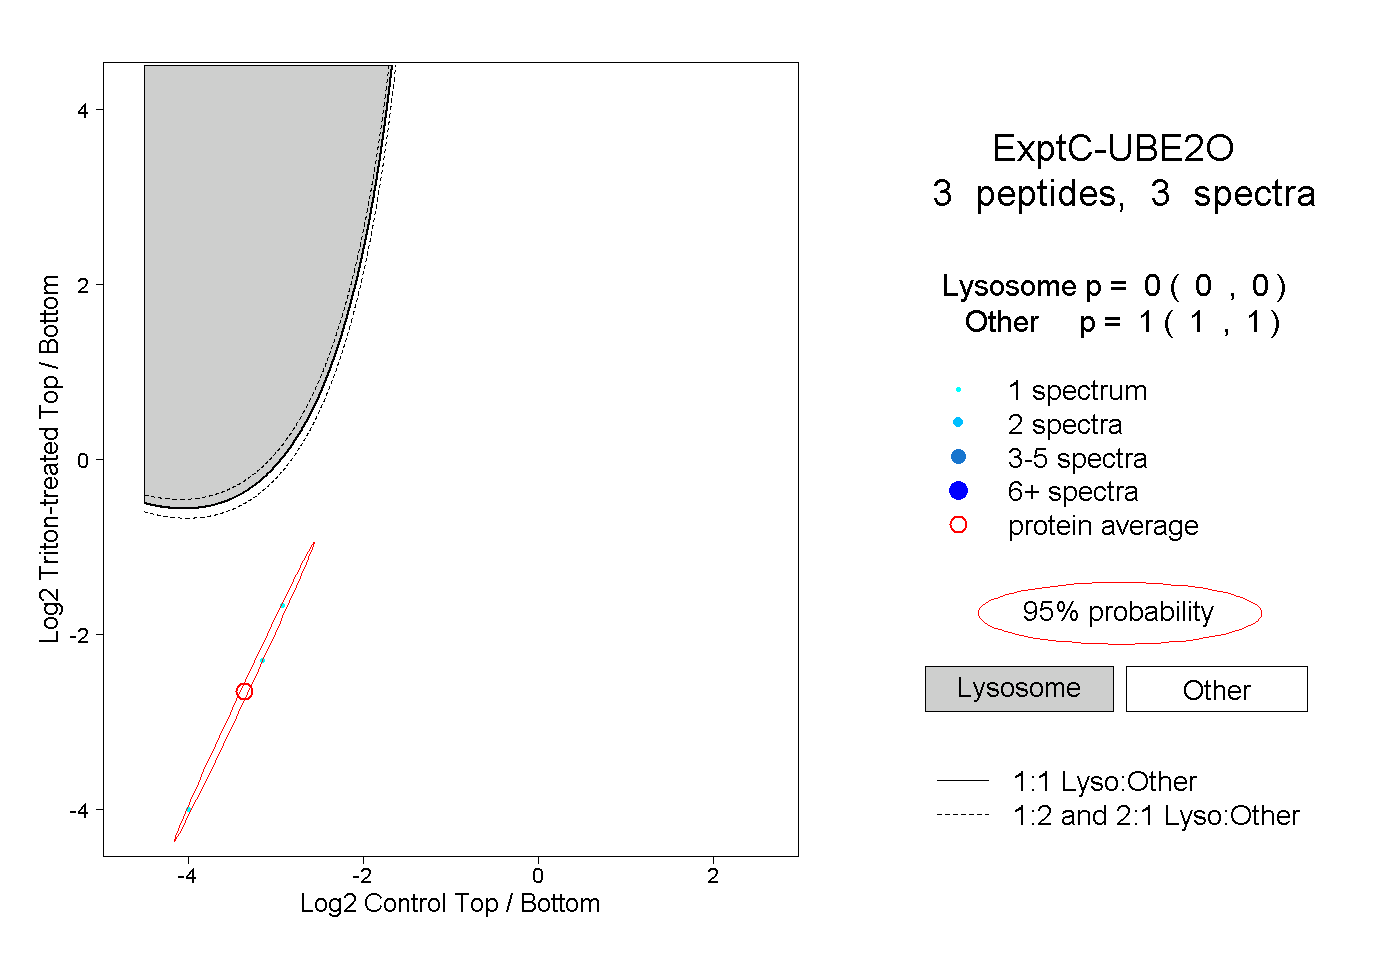
0.000 | 0.000
1.000 | 1.000