 7
7peptides
spectra
0.000 | 0.000
0.000 | 0.041
0.000 | 0.054
0.000 | 0.000
0.000 | 0.000
0.212 | 0.255
0.709 | 0.741
0.000 | 0.000
| Plot | Mito | Lyso | Perox | ER | Golgi | PM | Cytosol | Nucleus | |||||
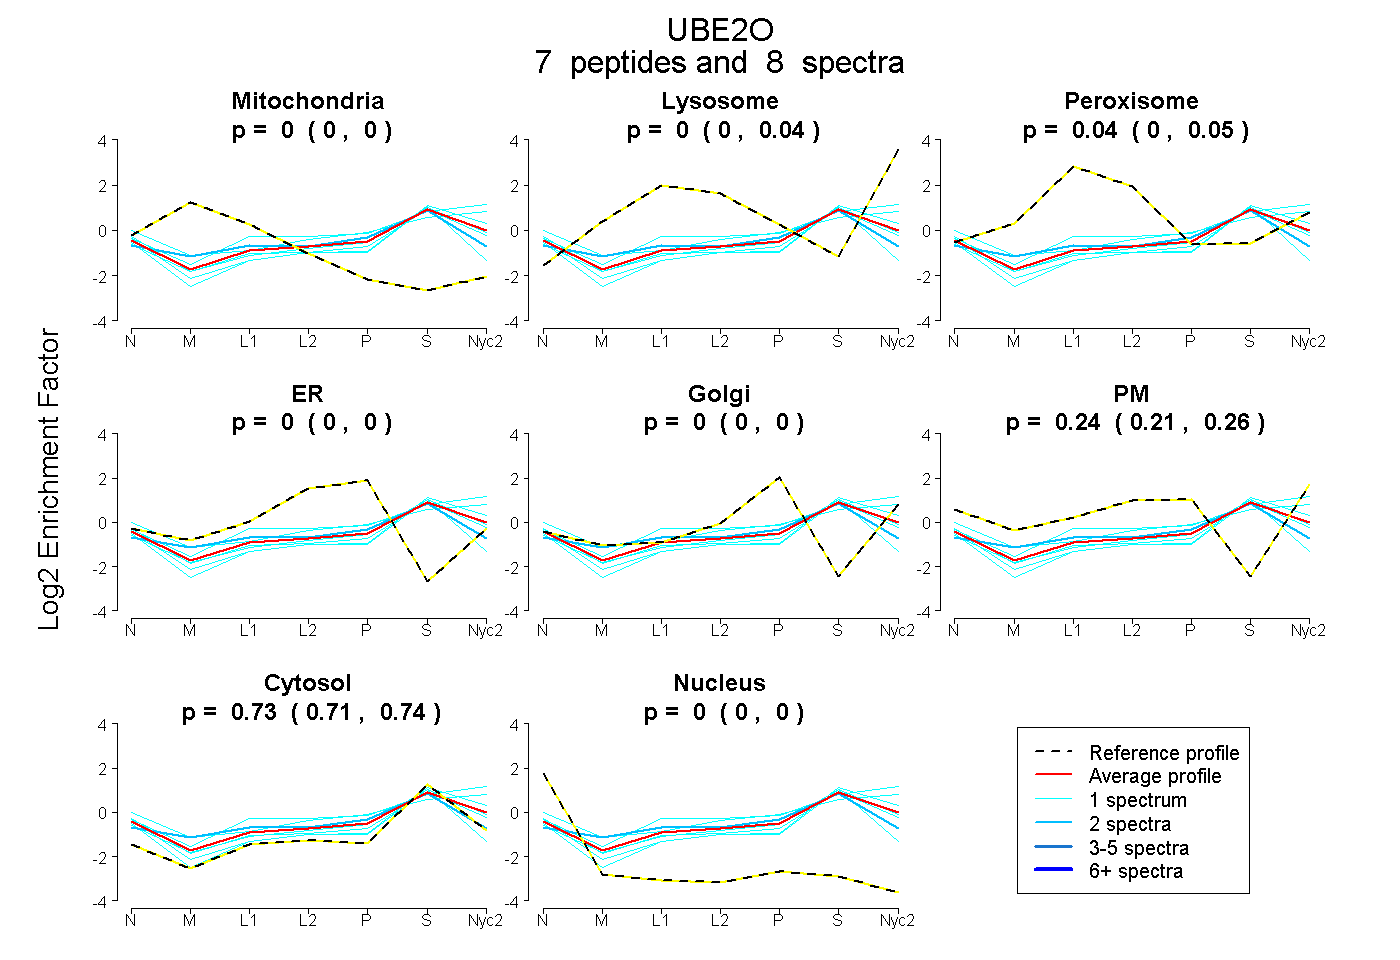
| Expt A |
7 peptides |
8 spectra |
|
0.000 0.000 | 0.000 |
0.000 0.000 | 0.041 |
0.036 0.000 | 0.054 |
0.000 0.000 | 0.000 |
0.000 0.000 | 0.000 |
0.239 0.212 | 0.255 |
0.725 0.709 | 0.741 |
0.000 0.000 | 0.000 |
| 1 spectrum, MDLFSALIK | 0.000 | 0.239 | 0.000 | 0.000 | 0.000 | 0.190 | 0.571 | 0.000 | ||
| 1 spectrum, GLQEGYENSR | 0.000 | 0.000 | 0.061 | 0.056 | 0.000 | 0.000 | 0.776 | 0.107 | ||
| 1 spectrum, AALLEAGMPESTEDK | 0.000 | 0.011 | 0.000 | 0.000 | 0.000 | 0.216 | 0.773 | 0.000 | ||
| 1 spectrum, SFLPEK | 0.000 | 0.000 | 0.005 | 0.000 | 0.000 | 0.219 | 0.771 | 0.006 | ||
| 2 spectra, RPPEVFEQEIR | 0.048 | 0.000 | 0.155 | 0.019 | 0.124 | 0.000 | 0.653 | 0.000 | ||
| 1 spectrum, IAWECPEK | 0.000 | 0.012 | 0.000 | 0.000 | 0.000 | 0.160 | 0.828 | 0.000 | ||
| 1 spectrum, FFSTVR | 0.000 | 0.063 | 0.000 | 0.000 | 0.000 | 0.376 | 0.561 | 0.000 |
| Plot | Mito | Lyso or Perox | ER | Golgi | PM | Cytosol | Nucleus | ||||||
| Expt B |
1 peptide |
1 spectrum |
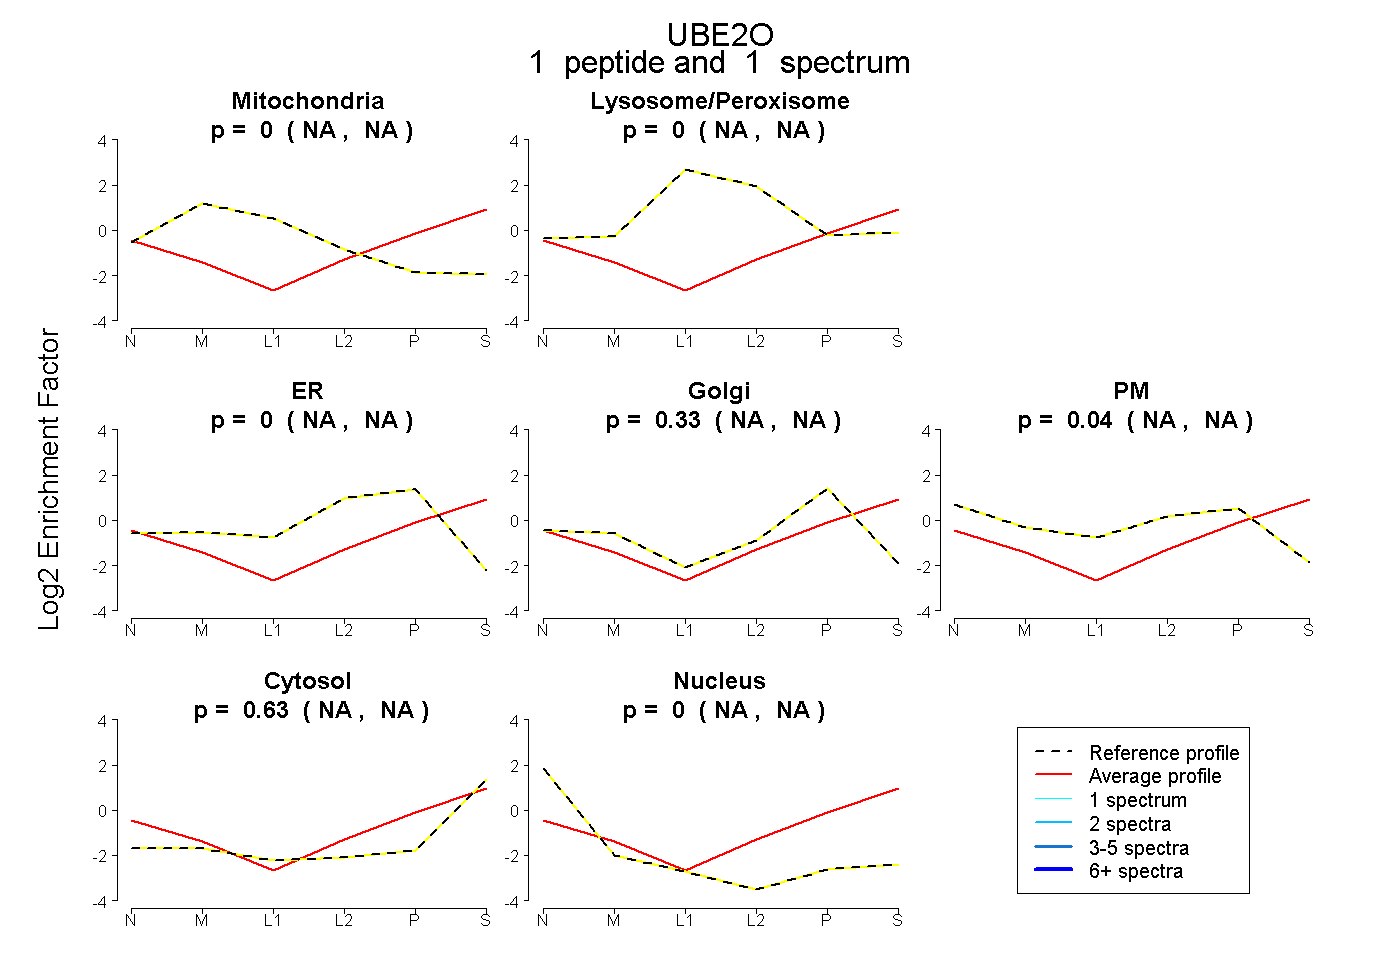 |
0.000 NA | NA |
0.000 NA | NA |
0.000 NA | NA |
0.334 NA | NA |
0.041 NA | NA |
0.625 NA | NA |
0.000 NA | NA |
|||
| Plot | Lyso | Other | |||||||||||
| Expt C |
3 peptides |
3 spectra |
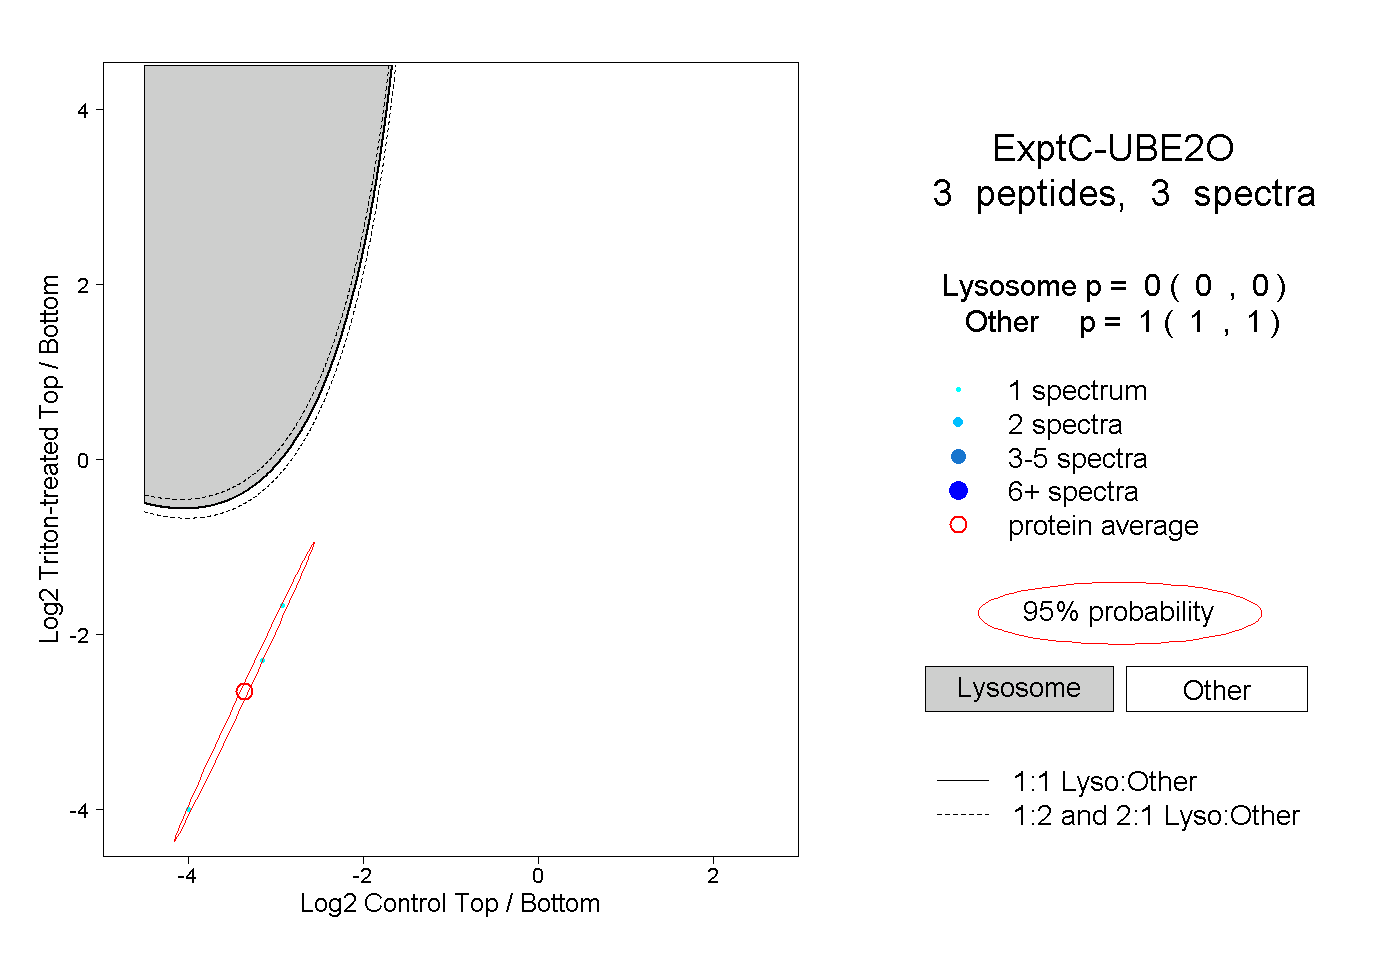 |
0.000 0.000 | 0.000 |
1.000 1.000 | 1.000 |