 5
5peptides
spectra
0.000 | 0.000
0.000 | 0.000
0.035 | 0.129
0.133 | 0.278
0.229 | 0.422
0.000 | 0.123
0.283 | 0.342
0.000 | 0.000
4peptides
spectra
0.000 | 0.000
1.000 | 1.000
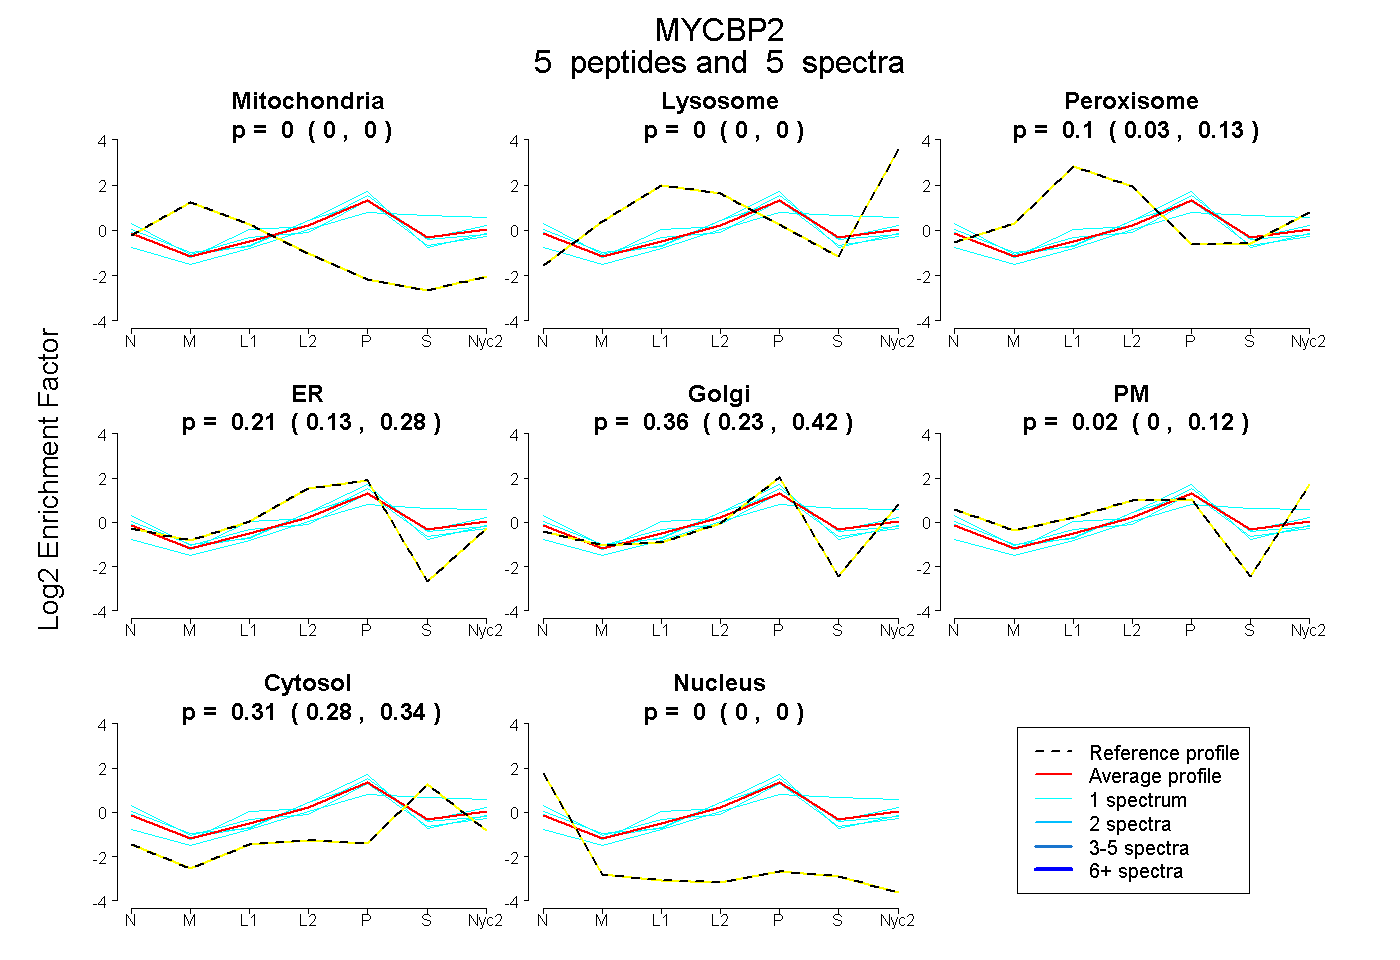
| Plot | Mito | Lyso | Perox | ER | Golgi | PM | Cytosol | Nucleus | |||||
| Expt A |
5 peptides |
5 spectra |
|
0.000 0.000 | 0.000 |
0.000 0.000 | 0.000 |
0.100 0.035 | 0.129 |
0.207 0.133 | 0.278 |
0.363 0.229 | 0.422 |
0.018 0.000 | 0.123 |
0.312 0.283 | 0.342 |
0.000 0.000 | 0.000 |
||
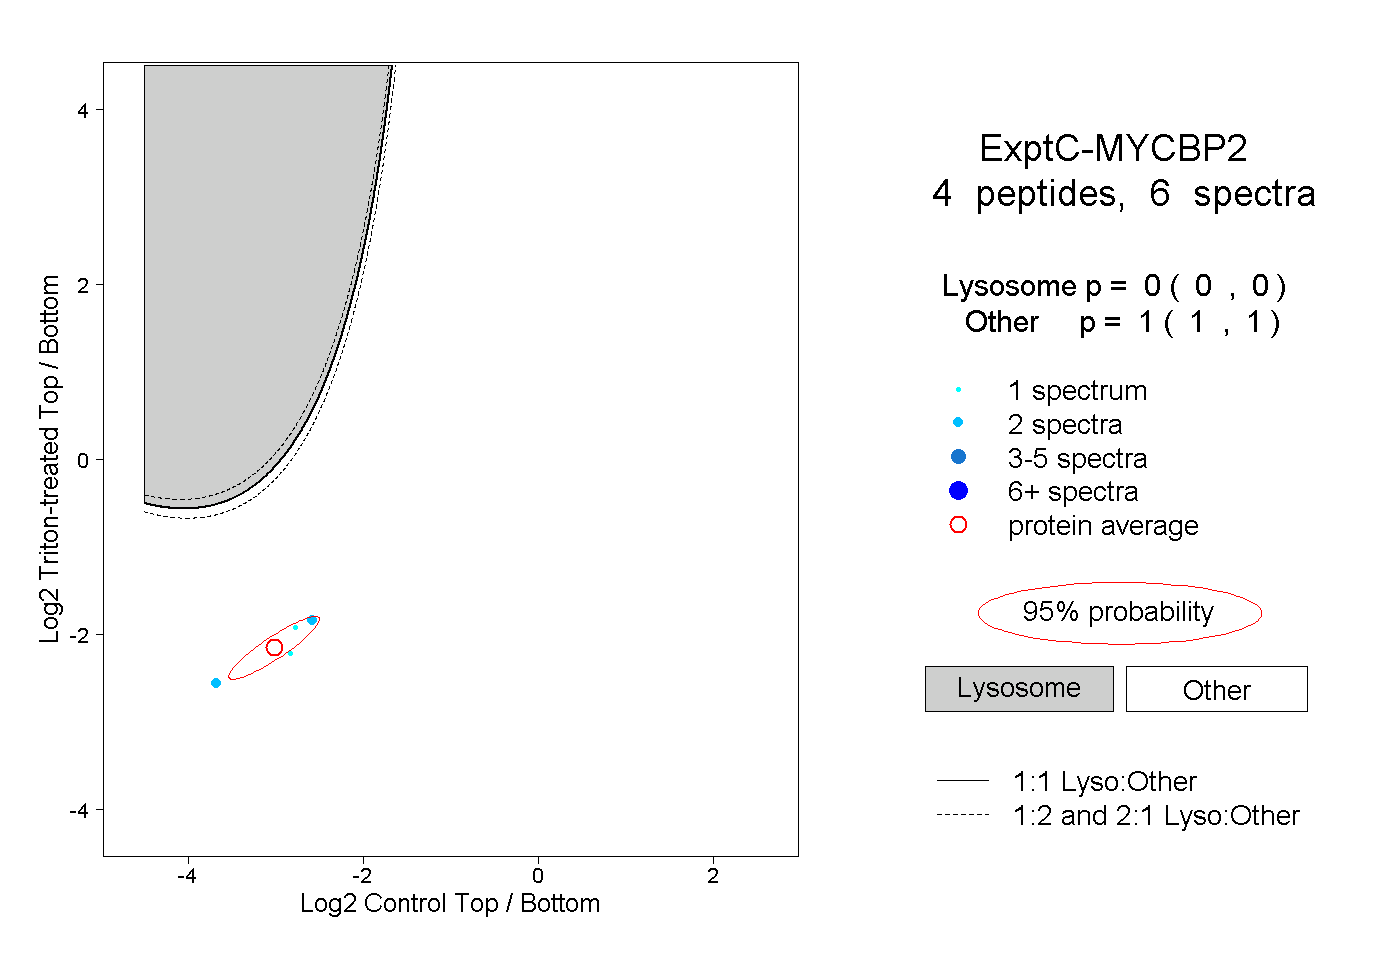
| Plot | Lyso | Other | |||||||||||
| Expt C |
4 peptides |
6 spectra |
|
0.000 0.000 | 0.000 |
1.000 1.000 | 1.000 |