 5
5peptides
spectra
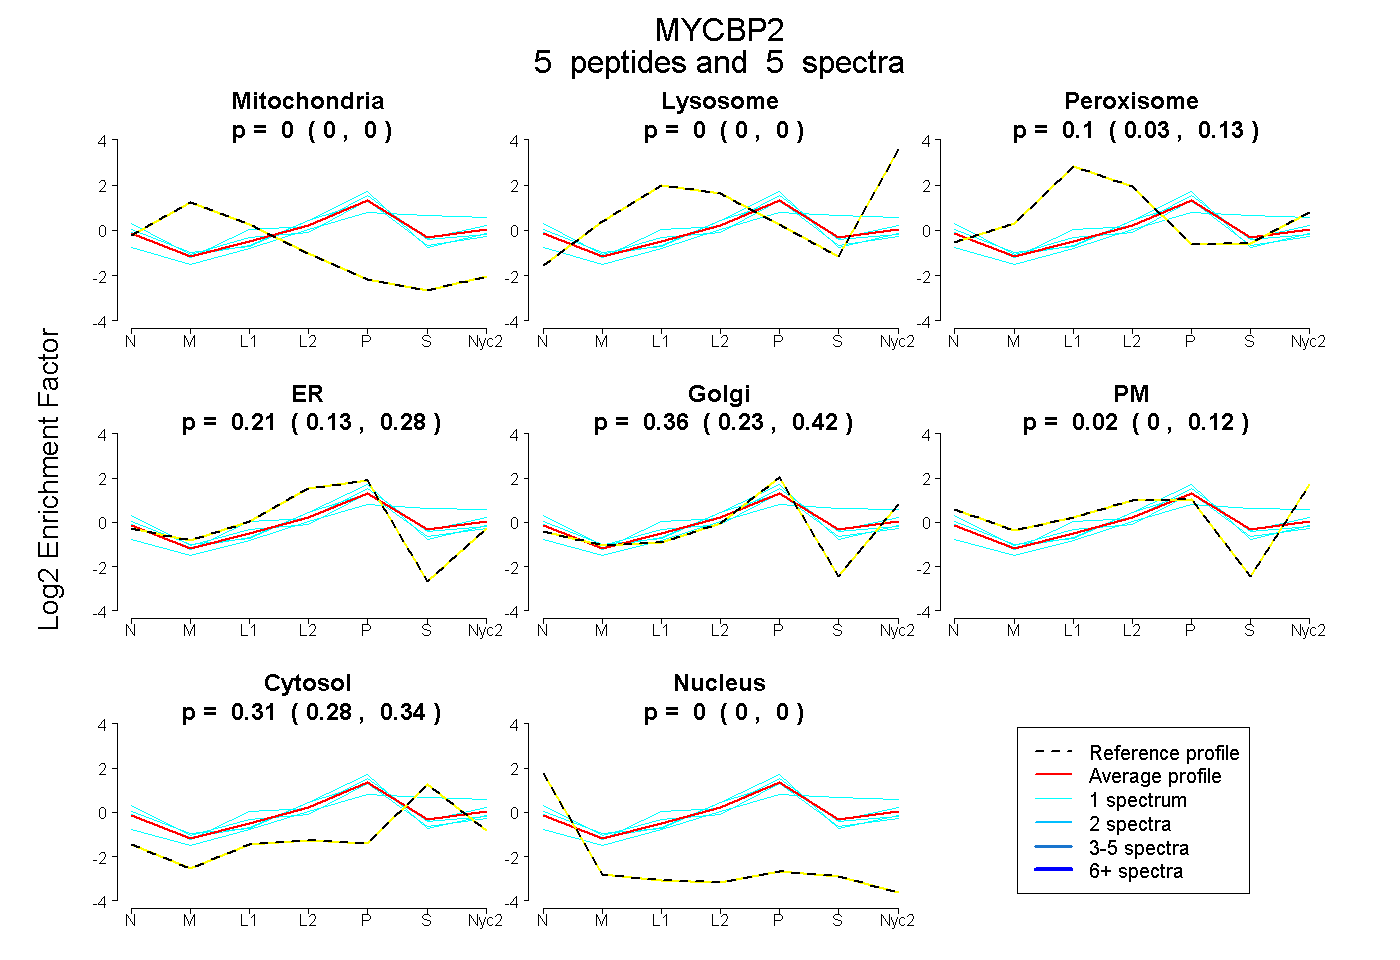
0.000 | 0.000
0.000 | 0.000
0.035 | 0.129
0.133 | 0.278
0.229 | 0.422
0.000 | 0.123
0.283 | 0.342
0.000 | 0.000
| Plot | Mito | Lyso | Perox | ER | Golgi | PM | Cytosol | Nucleus | |||||
| Expt A |
5 peptides |
5 spectra |
|
0.000 0.000 | 0.000 |
0.000 0.000 | 0.000 |
0.100 0.035 | 0.129 |
0.207 0.133 | 0.278 |
0.363 0.229 | 0.422 |
0.018 0.000 | 0.123 |
0.312 0.283 | 0.342 |
0.000 0.000 | 0.000 |
| 1 spectrum, EPPLHEK | 0.000 | 0.000 | 0.074 | 0.246 | 0.305 | 0.079 | 0.272 | 0.024 | ||
| 1 spectrum, ELDGQEAR | 0.000 | 0.000 | 0.000 | 0.264 | 0.139 | 0.268 | 0.328 | 0.000 | ||
| 1 spectrum, GQIPQILYYR | 0.000 | 0.000 | 0.128 | 0.316 | 0.277 | 0.000 | 0.279 | 0.000 | ||
| 1 spectrum, ALSVVSTVVR | 0.000 | 0.000 | 0.004 | 0.436 | 0.299 | 0.000 | 0.261 | 0.000 | ||
| 1 spectrum, LITPVR | 0.000 | 0.179 | 0.000 | 0.023 | 0.297 | 0.000 | 0.502 | 0.000 |
| Plot | Lyso | Other | |||||||||||
| Expt C |
4 peptides |
6 spectra |
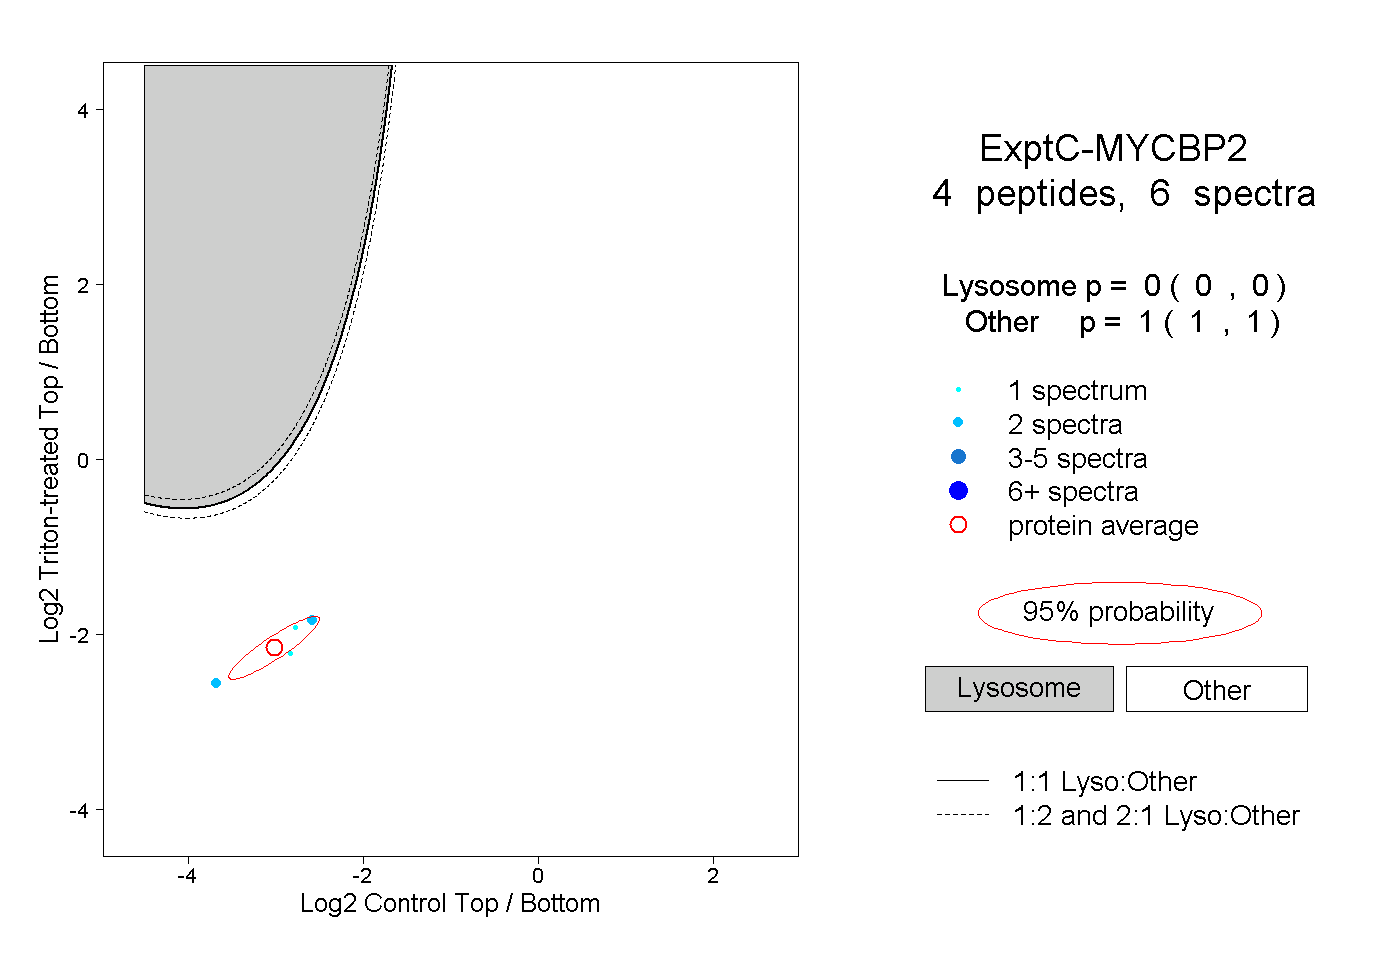 |
0.000 0.000 | 0.000 |
1.000 1.000 | 1.000 |